Your query returned 124 graphics.
Results 76 - 90
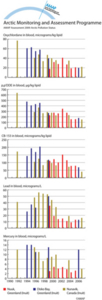
Temporal trends of POPs and metals in maternal blood samples from Nuuk and Disko Bay, GreenlandTemporal trends of POPs and metals in maternal blood samples from Nuuk and Disko Bay, Greenland |

|
Changes over time in levels of legacy POPs and metals in blood of pregnant women from three communities in Greenland and CanadaChanges over time in levels of legacy POPs and metals in blood of pregnant women from three communities in Greenland and Canada |
|
Time trends of mean methylmercury concentrationsTime trends of mean methylmercury concentrations |

|
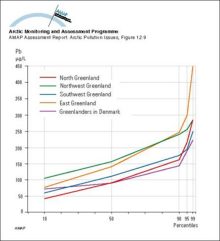
Distribution (in percentiles) of whole blood lead concentrations in four regions in Greenland and in Greenlanders living in DenmarkDistribution (in percentiles) of whole blood lead concentrations in four regions in Greenland and in Greenlanders living in Denmark |
|
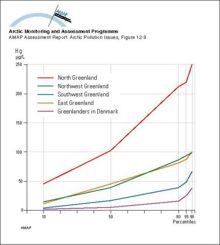
Distribution (in percentiles) of whole blood mercury concentrations in four regions in Greenland and in Greenlanders living in DenmarkDistribution (in percentiles) of whole blood mercury concentrations in four regions in Greenland and in Greenlanders living in Denmark |
|
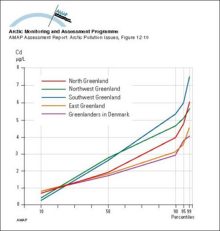
Distribution (in percentiles) of whole blood cadmium concentrations in four regions in Greenland and in Greenlanders living in DenmarkDistribution (in percentiles) of whole blood cadmium concentrations in four regions in Greenland and in Greenlanders living in Denmark |
|
Spatial distribution of emissions of Pb within the 150 km x 150 km EMEP grid system for the area north of latitude 50° N in 1989Spatial distribution of emissions of Pb within the 150 km x 150 km EMEP grid system for the area north of latitude 50° N in 1989 |

|
Global emissions of Pb to the atmosphere from various sources and source regions in 1989 Numbers under the columns are maximum estimates of the total emissions in tonnesGlobal emissions of Pb to the atmosphere from various sources and source regions in 1989 Numbers under the columns are maximum estimates of the total emissions in tonnes |

|
Spatial distribution of global emissions of Hg in 1990 within a 1° x 1° grid The total emission inventory is 2144 tonnes HgSpatial distribution of global emissions of Hg in 1990 within a 1° x 1° grid The total emission inventory is 2144 tonnes Hg |

|
Contributions from different continents and from different sources to the global emissions of Hg to the atmosphereContributions from different continents and from different sources to the global emissions of Hg to the atmosphere |

|
The ten major point sources, and their emissions of As and Cd to the atmosphere, in Europe at the beginning of the 1990s Numbers above the columns are emissions in tonnes per yearThe ten major point sources, and their emissions of As and Cd to the atmosphere, in Europe at the beginning of the 1990s Numbers above the columns are emissions in tonnes per year |

|
Changes with time in European atmospheric emissions of Cd, Pb and ZnChanges with time in European atmospheric emissions of Cd, Pb and Zn |

|
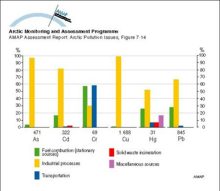
Estimates of emissions of As, Cd, Hg and Pb to the atmosphere from major source categories in the United States Numbers under the columns are emissions in tonnes per yearEstimates of emissions of As, Cd, Hg and Pb to the atmosphere from major source categories in the United States Numbers under the columns are emissions in tonnes per year |

|
Estimates of emissions of As, Cd, Cr, Cu, Hg and Pb to the atmosphere from major source categories in Canada in 1982 Numbers under the columns are emissions in tonnes per yearEstimates of emissions of As, Cd, Cr, Cu, Hg and Pb to the atmosphere from major source categories in Canada in 1982 Numbers under the columns are emissions in tonnes per year |
|
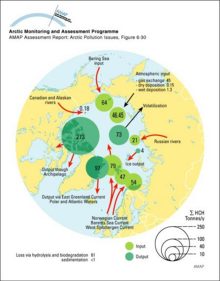
Sum-HCH budget for the Arctic Ocean (tonnes/y)Sum-HCH budget for the Arctic Ocean (tonnes/y) |
|

water OR waste searches for either of these words
oceans AND biodiversity searches for blocks with both words
pollution NEAR water searches for blocks with either of these words, with them being closer ranks higher
"climate change" searches for this phrase