|
(a) Trajectories of five satellite-tracked buoys launched in Mackenzie Bay, Canada, and (b) results of 30-day trajectories of oil launched from five hypothetical spill locations in the Beaufort Sea
|

|
|
Model evaluation comparing a five-day model simulation with results of an oil release experiment in the marginal ice zone near Svalbard in April 1993
|

|
|
Illustration of the role of UV radiation in various light-dependent processes Natural UV radiation impacts the numbers, distribution and activity of several aquatic ecosystem targets and thus, [..]
|

|
|
Vertical distribution of Arctic haze in summer, winter, and the whole year Sulfur air concentrations and relative source-contribution (%) for different heights above the ground are shown The [..]
|

|
|
Temporal variation in calculated reindeer Tag values for different Arctic regions
|

|
|
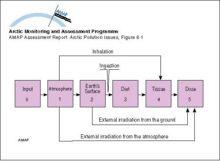
Compartment model used to assess doses from releases of radioactive materials to the atmosphere from nuclear testing
|
|
|
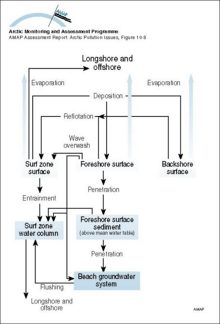
Mass transport pathways considered in the Coastal Zone Oil Spill Model (COZOIL), developed to simulate dynamic transport and weathering of oil on US Arctic coasts
|
|
|
An example of a positive feedback loop Warming leads to a decrease in sea ice cover which in turn leads to a decrease in albedo over the ocean, the result of which is further warming and further [..]
|

|
|
The hydrologic balance in the Arctic is highly dynamic on the seasonal time scale with large and rapid ice melts in the spring On land, this ice and snow melting results in large rapid floods and [..]
|

|
|
A multi-compartment schematic diagram of the major pathways of contaminants into and within the Arctic environment
|

|
|
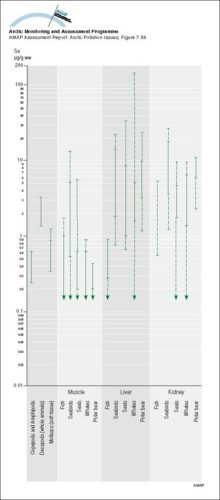
Summary of ranges of Se levels (mean values) in Arctic marine organisms Solid parts of the lines indicate ranges for Greenlandic data
|
|
|
Schematic diagram of the Combined Model Ten climatic zones, each containing well-mixed compartments, are connected by meridional atmospheric and oceanic exchange
|

|
|
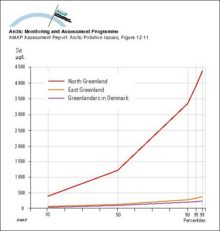
Distribution (in percentiles) of whole blood selenium concentrations in East and North Greenland and in Greenlanders living in Denmark
|
|
|
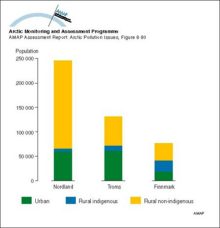
Distribution of the population of the three Arctic Norwegian counties
|
|
|
A schematic of the three-level thermodynamic snow ice system model
|
|

water OR waste searches for either of these words
oceans AND biodiversity searches for blocks with both words
pollution NEAR water searches for blocks with either of these words, with them being closer ranks higher
"climate change" searches for this phrase