Your query returned 102 graphics.
Results 1 - 15
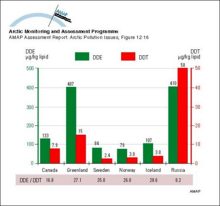
Mean maternal plasma lipid concentrations of DDE and DDT; figures below the graph show the DDE/DDT ratiosMean maternal plasma lipid concentrations of DDE and DDT; figures below the graph show the DDE/DDT ratios |
|
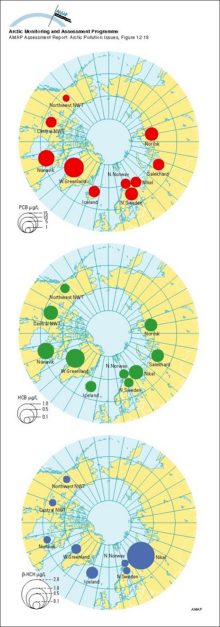
Geometric mean concentrations of PCB, HCB and B-HCH in maternal blood plasma; AMAP circumpolar study 1995, see Table 12A12Geometric mean concentrations of PCB, HCB and B-HCH in maternal blood plasma; AMAP circumpolar study 1995, see Table 12A12 |
|
Model calculations of sulfur deposition and fraction of dry deposition for the period July 1990 to June 1991 in northern Fennoscandia and the Kola PeninsulaModel calculations of sulfur deposition and fraction of dry deposition for the period July 1990 to June 1991 in northern Fennoscandia and the Kola Peninsula |

|
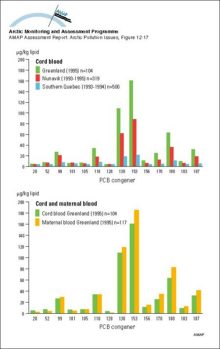
PCB congener profiles in cord blood of Canadian and Greenlandic population groups, and in cord and maternal blood from GreenlandPCB congener profiles in cord blood of Canadian and Greenlandic population groups, and in cord and maternal blood from Greenland |
|
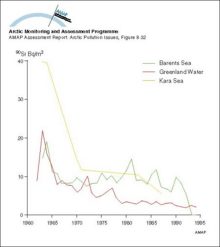
Changes with time in 90Sr activity concentrations in surface seawater from Greenland waters and the Barents and Kara SeasChanges with time in 90Sr activity concentrations in surface seawater from Greenland waters and the Barents and Kara Seas |
|
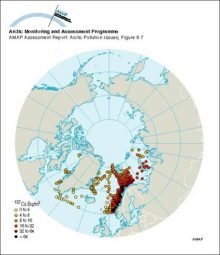
Cs-137 activity concentrations in surface seawater in 1979 and 1982Cs-137 activity concentrations in surface seawater in 1979 and 1982 |
|
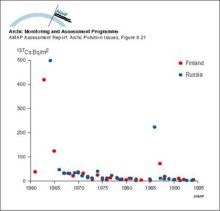
Seawater concentrations of 137Cs in the Barents and East Greenland Seas compared to the yearly releases from SellafieldSeawater concentrations of 137Cs in the Barents and East Greenland Seas compared to the yearly releases from Sellafield |

|
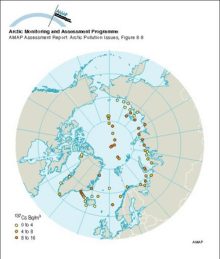
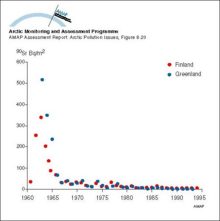
Cs-137 activity concentrations in surface seawater in 1994Cs-137 activity concentrations in surface seawater in 1994 |
|
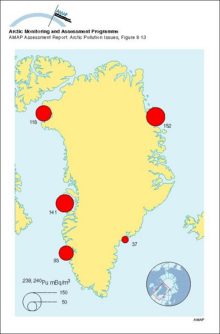
Concentrations of 239,240Pu in seawater around Greenland, 1968Concentrations of 239,240Pu in seawater around Greenland, 1968 |
|
Distribution of organochlorine contaminants (OCs) in Arctic air, snow, seawater, and the marine mammals food chain Data for the six major classes of OCs are plotted for each compartment or species as the percent ofDistribution of organochlorine contaminants (OCs) in Arctic air, snow, seawater, and the marine mammals food chain Data for the six major classes of OCs are plotted for each compartment or species as [..] |

|
alpha-HCH (ng/L) in seawater: an illustration of the cold condensation effectalpha-HCH (ng/L) in seawater: an illustration of the cold condensation effect |
|
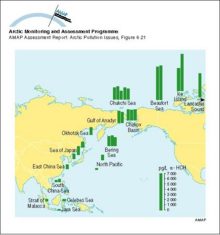
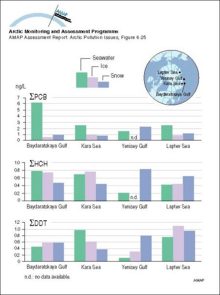
Concentrations of sum-PCB, sum-HCH, and sum-DDT in seawater, ice, and overlying snow collected at approximately the same locations in the Russian Arctic in 1993-95Concentrations of sum-PCB, sum-HCH, and sum-DDT in seawater, ice, and overlying snow collected at approximately the same locations in the Russian Arctic in 1993-95 |
|
Changes with time in wet and dry deposition of 137Cs in Arctic Finland and north west Russia (Nenets Autonomous Okrug)Changes with time in wet and dry deposition of 137Cs in Arctic Finland and north west Russia (Nenets Autonomous Okrug) |
|
Changes with time in wet and dry deposition of 90Sr in Arctic Finland and GreenlandChanges with time in wet and dry deposition of 90Sr in Arctic Finland and Greenland |
|
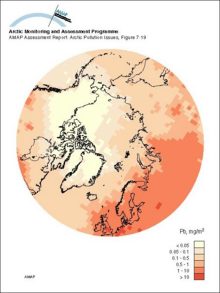
Lead deposition as modeled by the updated (1996) hemispheric EMEP transport model in a simulation for the reference year 1988Lead deposition as modeled by the updated (1996) hemispheric EMEP transport model in a simulation for the reference year 1988 |
|

water OR waste searches for either of these words
oceans AND biodiversity searches for blocks with both words
pollution NEAR water searches for blocks with either of these words, with them being closer ranks higher
"climate change" searches for this phrase