Your query returned 102 graphics.
Results 91 - 102
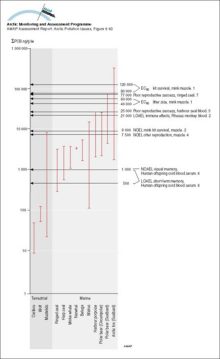
Sum-PCB (ng/g lw) in Arctic mammals compared to thresholds for mammalian effects (1 Leonards et al 1995, 2 Tryphonas 1994, 3 Kihlström et al 1992, 4 Olsson et al 1996a, 5 Boon et al 1987, 6 Ahlborg et al 1992, 7 Helle et al 1976b)Sum-PCB (ng/g lw) in Arctic mammals compared to thresholds for mammalian effects (1 Leonards et al 1995, 2 Tryphonas 1994, 3 Kihlström et al 1992, 4 Olsson et al 1996a, 5 Boon et al 1987, 6 Ahlborg et [..] |
|
Organochlorine levels in polar bear adipose tissues (µg/g lw), adjusted to levels expected in 11-year-old males (after correction for age and sex), for sum-PCB, sum-CHL, sum-HCH, and sum-CBz, and in Arctic fox from Svalbard for sum-PCB and sum-CHLOrganochlorine levels in polar bear adipose tissues (µg/g lw), adjusted to levels expected in 11-year-old males (after correction for age and sex), for sum-PCB, sum-CHL, sum-HCH, and sum-CBz, and in [..] |
|
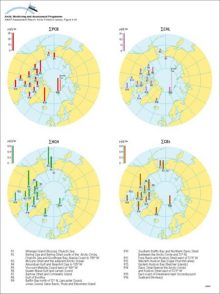
Contaminant emissions, transport and deposition in the ArcticAn illustration of the interplay between a) contaminant emissions distribution for sulfur dioxide and b) frequency of atmospheric south-to-north transport, yielding c) a net annual input of sulfur to [..] |

|
Atmosphere-surface exchangeSchematic diagram of processes of atmosphere-surface exchange |

|
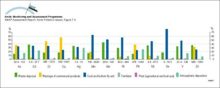
Global anthropogenic inputs of trace metals to soils at the beginning of the 1980s Numbers under the columns are the range of estimates of the inputs in thousands of tonnes per yearGlobal anthropogenic inputs of trace metals to soils at the beginning of the 1980s Numbers under the columns are the range of estimates of the inputs in thousands of tonnes per year |
|
Changes with time in 137Cs contamination in the food chain lichen - reindeer - humansChanges with time in 137Cs contamination in the food chain lichen - reindeer - humans |

|
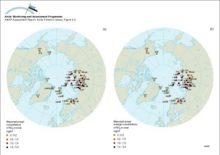
Concentrations of (a) sulfate and (b) nitrate in snowConcentrations of (a) sulfate and (b) nitrate in snow |
|
Historical records of a) NO3- and b) SO42- concentrations from the Greenland icecap at Dye 3 c) A comparison of trends in the average SO42- and SO42- plus NO3- concentrations at Dye 3 in Greenland and in the annual mean H+ concentration from Agassiz iceHistorical records of a) NO3- and b) SO42- concentrations from the Greenland icecap at Dye 3 c) A comparison of trends in the average SO42- and SO42- plus NO3- concentrations at Dye 3 in Greenland [..] |

|
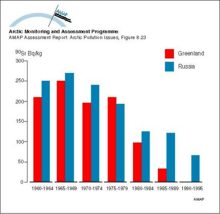
Changes with time in 90Sr activity concentration (5-year means) in lichens in Greenland and RussiaChanges with time in 90Sr activity concentration (5-year means) in lichens in Greenland and Russia |
|
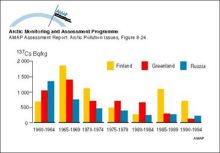
Changes with time in 137Cs activity concentrations (5-year means) in lichens in Arctic Finland, Greenland, and RussiaChanges with time in 137Cs activity concentrations (5-year means) in lichens in Arctic Finland, Greenland, and Russia |
|
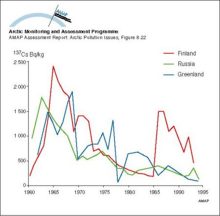
Changes with time in 137Cs activity concentration in lichen from Arctic Finland, north west Russia, and GreenlandChanges with time in 137Cs activity concentration in lichen from Arctic Finland, north west Russia, and Greenland |
|
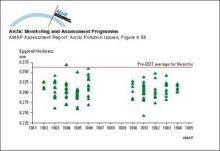
Shell thickness (mm) of peregrine falcon eggs representing 109 clutches produced in Rankin Inlet, NWT, Canada from 1981 to 1986 and from 1990 to 1994Shell thickness (mm) of peregrine falcon eggs representing 109 clutches produced in Rankin Inlet, NWT, Canada from 1981 to 1986 and from 1990 to 1994 |
|

water OR waste searches for either of these words
oceans AND biodiversity searches for blocks with both words
pollution NEAR water searches for blocks with either of these words, with them being closer ranks higher
"climate change" searches for this phrase