Your query returned 142 graphics.
Results 16 - 30
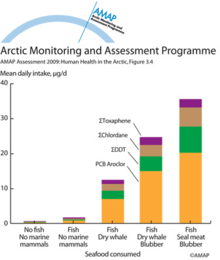
Daily intake of POPs in 90 daily food portions as a function of seafood types present in the dietDaily intake of POPs in 90 daily food portions as a function of seafood types present in the diet |
|
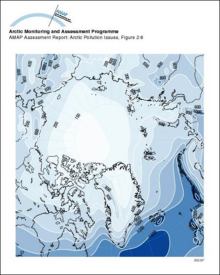
Precipitation in the ArcticDistribution of precipitation (mm/y) in the Arctic |
|
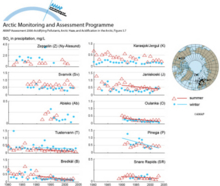
Trends in weighted summer and winter sulfate concentrations in precipitation within the ArcticTrends in weighted summer and winter sulfate concentrations in precipitation within the Arctic |
|
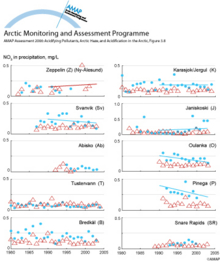
Trends in weighted summer and winter nitrate concentrations in precipitation within the ArcticTrends in weighted summer and winter nitrate concentrations in precipitation within the Arctic |
|
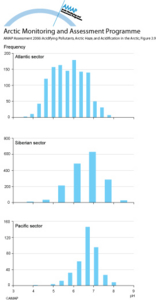
Frequency distribution for monthly pH values in precipitation within the Russian Arctic for the AtlanticFrequency distribution for monthly pH values in precipitation within the Russian Arctic for the Atlantic, Siberian, and Pacific sectors for 1990 to 2004 |
|
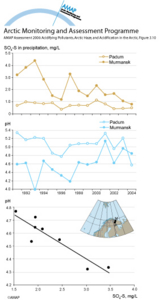
Annual average sulfate sulfur concentrations and pH in precipitation within the Russian ArcticAnnual average sulfate sulfur concentrations and pH in precipitation within the Russian Arctic at a heavily impacted site (Murmansk) and a background site (Padun) since 1991, and the correlation [..] |
|
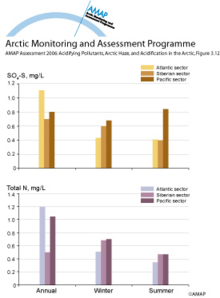
Annual and seasonal variations in average background levels of sulfate sulfur and total nitrogen in precipitation across the AtlanticAnnual and seasonal variations in average background levels of sulfate sulfur and total nitrogen in precipitation across the Atlantic, Siberian, and Pacific sectors of the Russian Arctic |
|
Time series of emissions of SO2 from European sources (Mylona 1993) and two major sources on the Kola PeninsulaTime series of emissions of SO2 from European sources (Mylona 1993) and two major sources on the Kola Peninsula |

|
The time series of (a) weekly-averaged non-seasalt (nss) sulfate aerosol at Alert, NWT, Canada, (b) monthly-averaged sulfate aerosol at Ny Ålesund, Norway, (c) weekly-averaged nitrate at Alert, and (d) weekly-averaged hydrogen ion at AlertThe time series of (a) weekly-averaged non-seasalt (nss) sulfate aerosol at Alert, NWT, Canada, (b) monthly-averaged sulfate aerosol at Ny Ålesund, Norway, (c) weekly-averaged nitrate at Alert, and [..] |

|
Emission rates of sulfur dioxide from Nikel together with annual average SO2 air concentrations measured at two sites in Norway (1978-1992)Emission rates of sulfur dioxide from Nikel together with annual average SO2 air concentrations measured at two sites in Norway (1978-1992) |

|
Historical records of a) NO3- and b) SO42- concentrations from the Greenland icecap at Dye 3 c) A comparison of trends in the average SO42- and SO42- plus NO3- concentrations at Dye 3 in Greenland and in the annual mean H+ concentration from Agassiz iceHistorical records of a) NO3- and b) SO42- concentrations from the Greenland icecap at Dye 3 c) A comparison of trends in the average SO42- and SO42- plus NO3- concentrations at Dye 3 in Greenland [..] |

|
Calculated concentrations of SO2 and SO42- compared with measurements at Station Nord in northeastern GreenlandCalculated concentrations of SO2 and SO42- compared with measurements at Station Nord in northeastern Greenland |

|
The time series of light scattering (?sp) and optical depth (?) at 500 nm at Barrow, AlaskaThe time series of light scattering (?sp) and optical depth (?) at 500 nm at Barrow, Alaska |

|
SMART model results for selected soil and lake output variables at Christmas lakes for the past 90 years and for three future scenarios assuming a 0%, 70% and 95% reduction of the present sulfur deposition levelsSMART model results for selected soil and lake output variables at Christmas lakes for the past 90 years and for three future scenarios assuming a 0%, 70% and 95% reduction of the present sulfur [..] |

|
Monthly snow cover anomalies over northern hemispheric lands (including Greenland) between January 1972 and August 1995 Also shown are the 12-month running anomalies of hemispheric snow extent, plotted on the seventh month of a given intervalMonthly snow cover anomalies over northern hemispheric lands (including Greenland) between January 1972 and August 1995 Also shown are the 12-month running anomalies of hemispheric snow extent, [..] |

|

water OR waste searches for either of these words
oceans AND biodiversity searches for blocks with both words
pollution NEAR water searches for blocks with either of these words, with them being closer ranks higher
"climate change" searches for this phrase