Your query returned 142 graphics.
Results 61 - 75
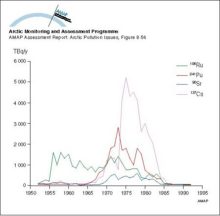
Discharges of principle beta-gamma emitters in liquid effluent from Sellafield, 1952-1992Discharges of principle beta-gamma emitters in liquid effluent from Sellafield, 1952-1992 |
|
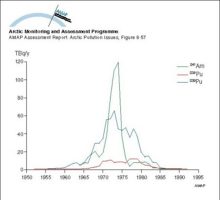
Discharges of principle alpha emitters in liquid effluent from Sellafield, 1952-1992Discharges of principle alpha emitters in liquid effluent from Sellafield, 1952-1992 |
|
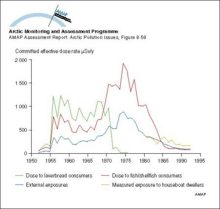
Comparison of doses to critical groups for Sellafield discharges from 1952 to 1993Comparison of doses to critical groups for Sellafield discharges from 1952 to 1993 |
|
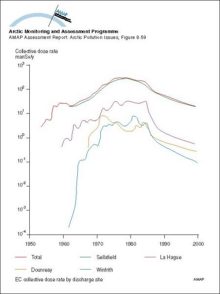
Collective dose rates from European nuclear fuel reprocessing plants based on releases up to 1986Collective dose rates from European nuclear fuel reprocessing plants based on releases up to 1986 |
|
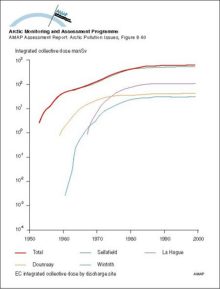
Collective dose commitment from nuclear fuel reprocessing activitiesCollective dose commitment from nuclear fuel reprocessing activities |
|
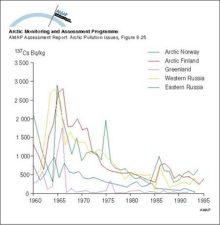
Changes with time in activity concentration of 137Cs in reindeer meat in Arctic Norway, Arctic Finland, Greenland, and Arctic RussiaChanges with time in activity concentration of 137Cs in reindeer meat in Arctic Norway, Arctic Finland, Greenland, and Arctic Russia |
|
Seasonal and annual average surface temperature trends (°C per decade) over the northern hemisphereSeasonal and annual average surface temperature trends (°C per decade) over the northern hemisphere |

|
Lower tropospheric temperatures since 1979, from satellite monitoring High variability is characteristic of the Arctic region due to its isolation from the moderating influences of warm, lower latitude, ocean currentsLower tropospheric temperatures since 1979, from satellite monitoring High variability is characteristic of the Arctic region due to its isolation from the moderating influences of warm, lower [..] |

|
Lower stratospheric temperature record since 1979Lower stratospheric temperature record since 1979 |

|
Lower stratospheric (ca 120-40 hPa) Arctic temperature trends (°C per decade, January 1979 to February 1996), as monitored by MSUs on polar orbiting satellitesLower stratospheric (ca 120-40 hPa) Arctic temperature trends (°C per decade, January 1979 to February 1996), as monitored by MSUs on polar orbiting satellites |

|
Predicted release rates of different radionuclide groups from the submarine reactor dumped in the Novaya Zemlya Trough (best estimate scenario)Predicted release rates of different radionuclide groups from the submarine reactor dumped in the Novaya Zemlya Trough (best estimate scenario) |

|
Dose estimates based on wholebody measurements (see Figure 836) for two groups (northern Saami and southern Saami) of Norwegian reindeer-breeding SaamiDose estimates based on wholebody measurements (see Figure 836) for two groups (northern Saami and southern Saami) of Norwegian reindeer-breeding Saami |

|
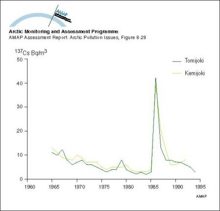
Changes with time in activity concentration of 137Cs in Finnish riversChanges with time in activity concentration of 137Cs in Finnish rivers |
|
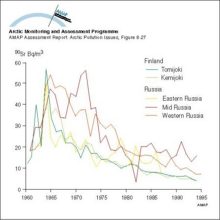
Changes with time in activity concentration of 90Sr in Russian and Finnish riversChanges with time in activity concentration of 90Sr in Russian and Finnish rivers |
|
Lower tropospheric Arctic temperature trends (°C per decade, January 1979 to February 1996), as monitored by MSUs on polar orbiting satellitesLower tropospheric Arctic temperature trends (°C per decade, January 1979 to February 1996), as monitored by MSUs on polar orbiting satellites |

|

water OR waste searches for either of these words
oceans AND biodiversity searches for blocks with both words
pollution NEAR water searches for blocks with either of these words, with them being closer ranks higher
"climate change" searches for this phrase