Your query returned 116 graphics.
Results 16 - 30
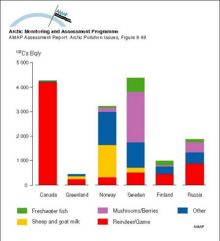
The relative contribution to the 137Cs content of the diet of the ‘average’ population of various Arctic areas for the period 1990 to 1994The relative contribution to the 137Cs content of the diet of the ‘average’ population of various Arctic areas for the period 1990 to 1994 |
|
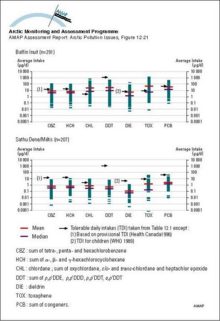
Organochlorine intake from traditional food consumed by indigenous women in the Canadian ArcticOrganochlorine intake from traditional food consumed by indigenous women in the Canadian Arctic |
|
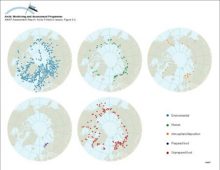
Geographical distribution of sample information in the AMAP radioactivity databaseGeographical distribution of sample information in the AMAP radioactivity database |
|
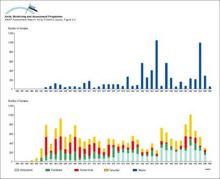
Available data in the AMAP radioactivity database as a function of timeAvailable data in the AMAP radioactivity database as a function of time |
|
Ranges and average values of 137Cs activity concentrations in food products, from data in the AMAP radioactivity databaseRanges and average values of 137Cs activity concentrations in food products, from data in the AMAP radioactivity database |

|
Distribution of radioactivity (PCi/L) in the surface layer of the ocean after ten years of simulation of Preller's model Source locations are the Ob, Yenisey and Pechora Rivers, as well as SellafieldDistribution of radioactivity (PCi/L) in the surface layer of the ocean after ten years of simulation of Preller's model Source locations are the Ob, Yenisey and Pechora Rivers, as well as Sellafield |

|
A comparison of the structures of the Bergen, Toronto, and Combined zonally-averaged global modelsA comparison of the structures of the Bergen, Toronto, and Combined zonally-averaged global models |
|
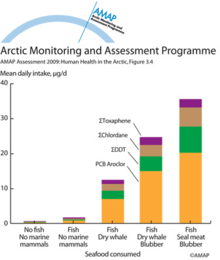
Daily intake of POPs in 90 daily food portions as a function of seafood types present in the dietDaily intake of POPs in 90 daily food portions as a function of seafood types present in the diet |
|
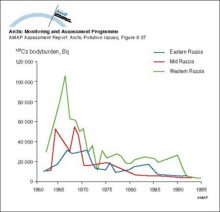
Changes with time in 137Cs wholebody measurements of Russian reindeer herdersChanges with time in 137Cs wholebody measurements of Russian reindeer herders |
|
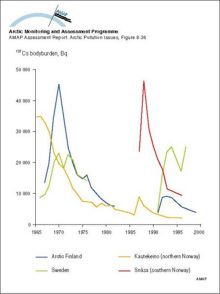
Changes with time in 137Cs wholebody measurements of reindeer herders in northern and central Norway, Arctic Finland, and SwedenChanges with time in 137Cs wholebody measurements of reindeer herders in northern and central Norway, Arctic Finland, and Sweden |
|
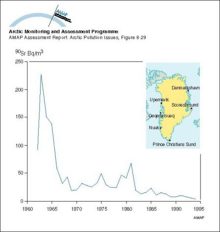
Changes with time in average activity concentration of 90Sr in drinking water in GreenlandChanges with time in average activity concentration of 90Sr in drinking water in Greenland |
|
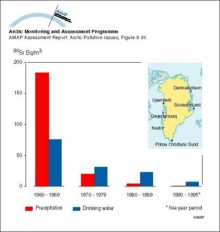
Ten-year averages of 90Sr activity concentrations in drinking water and precipitation in GreenlandTen-year averages of 90Sr activity concentrations in drinking water and precipitation in Greenland |
|
Changes with time in 137Cs contamination in the food chain lichen - reindeer - humansChanges with time in 137Cs contamination in the food chain lichen - reindeer - humans |

|
Temporal variation in calculated reindeer Tag values for different Arctic regionsTemporal variation in calculated reindeer Tag values for different Arctic regions |

|
Spatial trends in the net flux from reindeer meat in different Arctic areas, for the first year after an assumed uniform deposition of 100 kBq/m2Spatial trends in the net flux from reindeer meat in different Arctic areas, for the first year after an assumed uniform deposition of 100 kBq/m2 |

|

water OR waste searches for either of these words
oceans AND biodiversity searches for blocks with both words
pollution NEAR water searches for blocks with either of these words, with them being closer ranks higher
"climate change" searches for this phrase