|
Cs-137 activity concentrations in surface seawater in 1979 and 1982
|
|
|
Seawater concentrations of 137Cs in the Barents and East Greenland Seas compared to the yearly releases from Sellafield
|

|
|
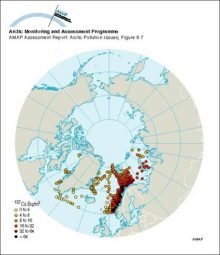
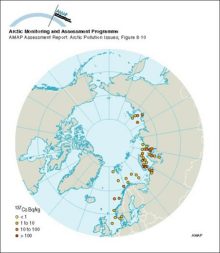
Average 137Cs activity concentrations in surface sediments of some Arctic seas sampled from 1992 to 1995
|
|
|
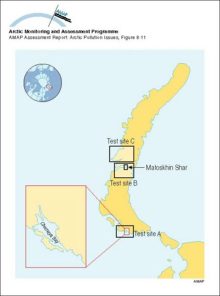
Nuclear weapons test sites on Novaya Zemlya
|
|
|
A schematic of the three-level thermodynamic snow ice system model
|

|
|
Yearly and depth-averaged concentrations (Bq/m3) of 137Cs after 6 years from Harms' model The sources are instantaneous releases of 1 PBq from the dump sites in Abrosimov Bay, Stepovogo Bay, Tsivolky [..]
|
|
|
Vertically integrated tracer burden shown after 15 years Units are burden per unit surface area, normalized by cumulative release Bottom topography is in meters; a) no neptune, centered difference, [..]
|
|
|
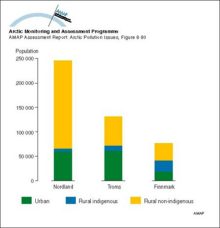
Distribution of the population of the three Arctic Norwegian counties
|
|
|
Scatterplots for comparisons between the average concentrations of SO2 and SO4 in air from October 1990 to December 1993 as monitored by the European Monitoring and Evaluation Programme (EMEP) and [..]
|

|
|
Calculated concentrations of SO2 and SO42- compared with measurements at Station Nord in northeastern Greenland
|

|
|
The predicted (1988) average surface air sulfate concentrations in the Arctic
|

|
|
The predicted (1988) average surface air sulfur dioxide concentrations in the Arctic
|

|
|
Model calculations of ground level yearly average sulfur dioxide air concentration on the Kola Peninsula
|

|
|
Model calculations of sulfur deposition and fraction of dry deposition for the period July 1990 to June 1991 in northern Fennoscandia and the Kola Peninsula
|

|
|
(a) The contribution from the different sources to the total deposition, averaged over the area north of 75°N from October 1990 to May 1994, (b) the calculated total monthly depositions of SOx [..]
|

|

water OR waste searches for either of these words
oceans AND biodiversity searches for blocks with both words
pollution NEAR water searches for blocks with either of these words, with them being closer ranks higher
"climate change" searches for this phrase