|
Monthly snow cover anomalies over northern hemispheric lands (including Greenland) between January 1972 and August 1995 Also shown are the 12-month running anomalies of hemispheric snow extent, [..]
|

|
|
Snow cover over northern hemisphere lands between 1972 and 1996 for different seasons Values are determined from analyses of NOAA snow charts created using visible satellite imagery
|

|
|
History of temperature changes in central Greenland over the last 40 000 years, from the GISP2 core, showing very large and probably abrupt changes
|

|
|
History of snow accumulation in central Greenland during the most recent glaciation, as measured in the GISP2 core The 25-year running mean, represented in all panels, shows very large and rapid [..]
|

|
|
Trends in (annual average) ozone mixing ratio over Canada from 1980 to 1993
|

|
|
Body burdens of radiocaesium (yearly averages) across the Canadian Arctic
|

|
|
Concentrations, as geometric means, of major organochlorine groups in burbot liver at Fort Good Hope, NWT, Canada (1986-94) Vertical bars denote standard errors
|

|
|
Temporal trends in levels of PCB, DDT, alpha-HCH, and HCB in muscle from Lake Storvindeln pike and Lake Abiskojaure char in Sweden Mean levels (µg/g lw) and 95% confidence intervals of the mean are [..]
|

|
|
Temporal trends in PCB and DDE levels in Arctic seabird eggs from Prince Leopold Island, Canada (1975-1993)
|

|
|
Levels of PCB congeners and PCDD/Fs (ng/g lw) in Lake Storvindeln pike muscle between 1968 and 1992
|

|
|
Temporal trends of sum-PCB and sum-DDT in blubber of female ringed seals from Holman Island in the western Canadian Arctic Vertical bars represent one SD
|

|
|
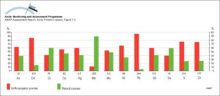
Trends in sum-PCB, sum-DDT, sum-CHL, and toxaphene over a ten year period (20 years for DDT in the Mackenzie Delta) for male narwhal and beluga blubber samples from the Canadian Arctic (N=8-26)
|

|
|
Trends in concentration of major organochlorines in blubber of female ringed seals over 6 to 10 years at 3 sites in the eastern Canadian Arctic (N=10-14 animals for each year/site)
|

|
|
Spatial distribution of emissions of Pb within the 150 km x 150 km EMEP grid system for the area north of latitude 50° N in 1989
|

|
|
Comparison of global emissions of trace metals to the atmosphere from natural and anthropogenic sources in 1983 Numbers under the columns are the median values of estimates of total emissions in [..]
|
|

water OR waste searches for either of these words
oceans AND biodiversity searches for blocks with both words
pollution NEAR water searches for blocks with either of these words, with them being closer ranks higher
"climate change" searches for this phrase