|
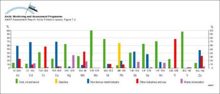
Global emissions of trace metals to the atmosphere at the beginning of the 1980s from anthropogenic sources
|
|
|
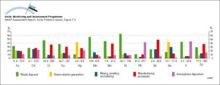
Global emissions of Pb to the atmosphere from various sources and source regions in 1989 Numbers under the columns are maximum estimates of the total emissions in tonnes
|

|
|
Spatial distribution of global emissions of Hg in 1990 within a 1° x 1° grid The total emission inventory is 2144 tonnes Hg
|

|
|
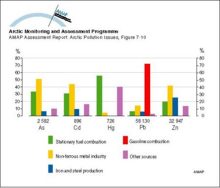
Contributions from different continents and from different sources to the global emissions of Hg to the atmosphere
|

|
|
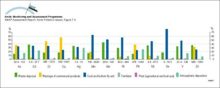
Global anthropogenic inputs of trace metals to aquatic ecosystems at the beginning of the 1980s Numbers under the columns are the range of estimates of the inputs in thousands of tonnes per year
|
|
|
Emissions of selected heavy metals to the atmosphere in Europe at the beginning of the 1990s Numbers under the columns are emissions in tonnes per year
|
|
|
Global anthropogenic inputs of trace metals to soils at the beginning of the 1980s Numbers under the columns are the range of estimates of the inputs in thousands of tonnes per year
|
|
|
The ten major point sources, and their emissions of As and Cd to the atmosphere, in Europe at the beginning of the 1990s Numbers above the columns are emissions in tonnes per year
|

|
|
Temporal trends in OC levels (ng/g lw) in reindeer from Abisko, Sweden Levels are usually based on a pool of 10 samples
|

|
|
Deposition of PCBs, as mono/di/trichloro- and tetra-nonachlorobiphenyls) in snow cores from the Agassiz Ice Cap (northern Ellesmere Island, Canada) Combined light and dark shaded sections of each bar [..]
|

|
|
Temporal trends in concentrations of sum-HCH and toxaphene in Arctic air
|

|
|
Temporal trends in PCB and DDT levels (µg/g lw ± 95% confidence limits) of otter muscle in Sweden Levels are based on means of 26, 16, and 28 samples (northern Sweden) and 29, 9, and 15 samples [..]
|

|
|
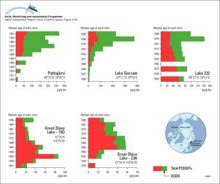
Historical profiles of PCBs (trichloro- and all other) in slices from dated sediment cores in Alaska, Canada, and Finland Median age of each slice is given on the vertical axis The green lines [..]
|

|
|
Concentration (pg/g dw) profiles for octachlorodioxin (OCDD) and total PCDD/Fs in dated sediment cores from Arctic Canada and Finland Sum-PCDD/Fs = sum of 2,3,7,8-substituted tetra- to octachloro D/Fs [..]
|
|
|
Transport of 90Sr, originating from Sellafield, along the coast of Norway The highest values are found in the Norwegian Coastal Current and decrease northward
|

|

water OR waste searches for either of these words
oceans AND biodiversity searches for blocks with both words
pollution NEAR water searches for blocks with either of these words, with them being closer ranks higher
"climate change" searches for this phrase