Your query returned 149 graphics.
Results 16 - 30
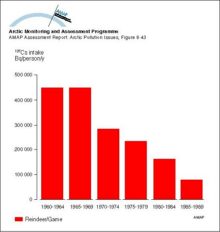
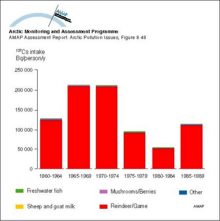
Yearly intake of 137Cs from various dietary components by the ‘selected’ population of GreenlandYearly intake of 137Cs from various dietary components by the ‘selected’ population of Greenland |
|
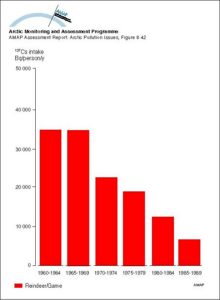
Yearly intake of 137Cs from various dietary components by the average population of GreenlandYearly intake of 137Cs from various dietary components by the average population of Greenland |
|
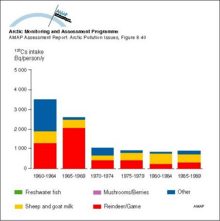
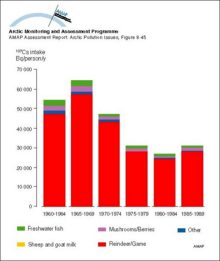
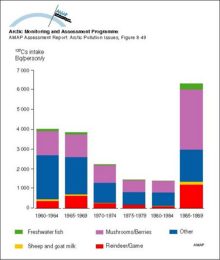
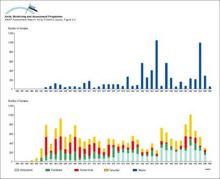
Yearly intake of 137Cs from various dietary components by the average population of Arctic CanadaYearly intake of 137Cs from various dietary components by the average population of Arctic Canada |
|
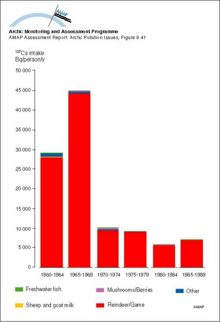
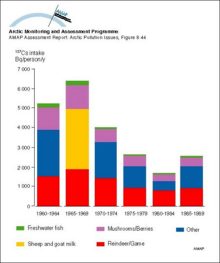
Yearly intake of 137Cs from various dietary components by the ‘selected’ population of Arctic CanadaYearly intake of 137Cs from various dietary components by the ‘selected’ population of Arctic Canada |
|
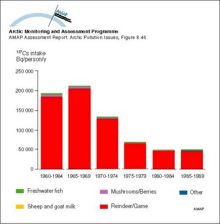
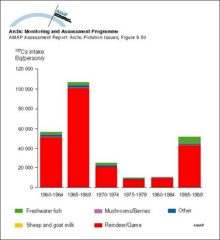
Yearly intake of 137Cs from various dietary components by the average population of Arctic RussiaYearly intake of 137Cs from various dietary components by the average population of Arctic Russia |
|
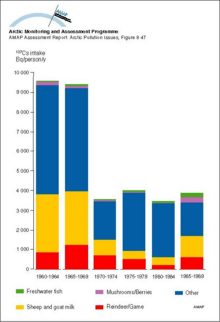
Yearly intake of 137Cs from various dietary components by the ‘selected’ population of eastern Arctic RussiaYearly intake of 137Cs from various dietary components by the ‘selected’ population of eastern Arctic Russia |
|
Yearly intake of 137Cs from various dietary components by the ‘selected’ population of western Arctic RussiaYearly intake of 137Cs from various dietary components by the ‘selected’ population of western Arctic Russia |
|
Yearly intake of 137Cs from various dietary components by the average population of Arctic NorwayYearly intake of 137Cs from various dietary components by the average population of Arctic Norway |
|
Yearly intake of 137Cs from various dietary components by the ‘selected’ population of Arctic NorwayYearly intake of 137Cs from various dietary components by the ‘selected’ population of Arctic Norway |
|
Yearly intake of 137Cs from various dietary components by the average population of Arctic SwedenYearly intake of 137Cs from various dietary components by the average population of Arctic Sweden |
|
Yearly intake of 137Cs from various dietary components by the ‘selected’ population of Arctic SwedenYearly intake of 137Cs from various dietary components by the ‘selected’ population of Arctic Sweden |
|
Distribution of radioactivity (PCi/L) in the surface layer of the ocean after ten years of simulation of Preller's model Source locations are the Ob, Yenisey and Pechora Rivers, as well as SellafieldDistribution of radioactivity (PCi/L) in the surface layer of the ocean after ten years of simulation of Preller's model Source locations are the Ob, Yenisey and Pechora Rivers, as well as Sellafield |

|
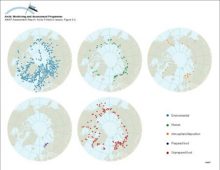
Geographical distribution of sample information in the AMAP radioactivity databaseGeographical distribution of sample information in the AMAP radioactivity database |
|
Available data in the AMAP radioactivity database as a function of timeAvailable data in the AMAP radioactivity database as a function of time |
|
Ranges and average values of 137Cs activity concentrations in food products, from data in the AMAP radioactivity databaseRanges and average values of 137Cs activity concentrations in food products, from data in the AMAP radioactivity database |

|

water OR waste searches for either of these words
oceans AND biodiversity searches for blocks with both words
pollution NEAR water searches for blocks with either of these words, with them being closer ranks higher
"climate change" searches for this phrase