|
Seasonal and annual average surface temperature trends (°C per decade) over the northern hemisphere
|

|
|
Lower tropospheric temperatures since 1979, from satellite monitoring High variability is characteristic of the Arctic region due to its isolation from the moderating influences of warm, lower [..]
|

|
|
Lower stratospheric temperature record since 1979
|

|
|
Lower stratospheric (ca 120-40 hPa) Arctic temperature trends (°C per decade, January 1979 to February 1996), as monitored by MSUs on polar orbiting satellites
|

|
|
Lower tropospheric Arctic temperature trends (°C per decade, January 1979 to February 1996), as monitored by MSUs on polar orbiting satellites
|

|
|
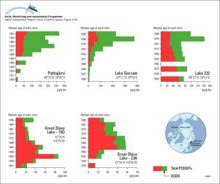
Dose estimates based on wholebody measurements (see Figure 836) for two groups (northern Saami and southern Saami) of Norwegian reindeer-breeding Saami
|

|
|
Concentration (pg/g dw) profiles for octachlorodioxin (OCDD) and total PCDD/Fs in dated sediment cores from Arctic Canada and Finland Sum-PCDD/Fs = sum of 2,3,7,8-substituted tetra- to octachloro D/Fs [..]
|
|
|
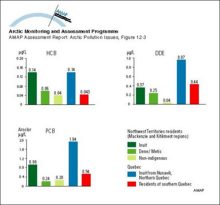
Geometric mean levels of HCB, DDE and PCBs in cord blood of newborns in different Canadian population groups
|
|
|
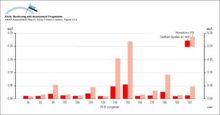
Concentrations of PCB congeners in cord plasma from Nunavik and southern Quebec newborns
|
|
|
Comparison of the predicted flux of 137Cs in milk and reindeer meat in different Arctic areas, for the first year after an assumed uniform deposition of 100 kBq/m2
|

|
|
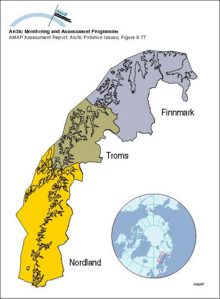
Norwegian counties considered in the flux vulnerability case study
|
|
|
Relative 137Cs output in foodstuffs from the different Arctic Norwegian counties in the first year after an assumed uniform deposition of 100 kBq/m2
|

|
|
The comparative importance of different foodstuffs as sources of 137Cs for the three Arctic Norwegian counties over the 1-year and 50-year period following an assumed uniform deposition of 100 kBq/m2
|

|
|
Spatial trends in the net flux from reindeer meat in different Arctic areas, for the first year after an assumed uniform deposition of 100 kBq/m2
|

|
|
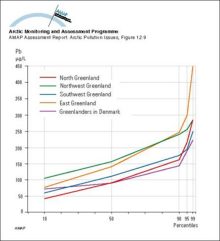
Distribution (in percentiles) of whole blood lead concentrations in four regions in Greenland and in Greenlanders living in Denmark
|
|

water OR waste searches for either of these words
oceans AND biodiversity searches for blocks with both words
pollution NEAR water searches for blocks with either of these words, with them being closer ranks higher
"climate change" searches for this phrase