|
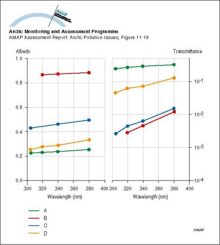
Ultraviolet albedo and transmittance values for (A) thin (03 m) bare sea; (B) cold 16 m thick ice with a 01 m deep snow cover in April; (C) bare 17 m thick ice in May; and, (D) ponded ice with 01 m of [..]
|
|
|
Model evaluation comparing a five-day model simulation with results of an oil release experiment in the marginal ice zone near Svalbard in April 1993
|

|
|
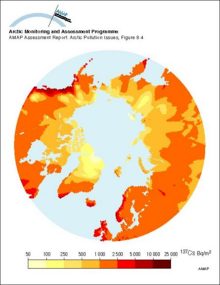
Estimated ground deposition of nuclear weapons fallout of 137Cs based on precipitation data, decay corrected to 1995
|
|
|
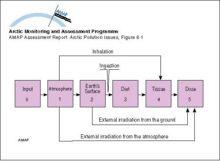
Compartment model used to assess doses from releases of radioactive materials to the atmosphere from nuclear testing
|
|
|
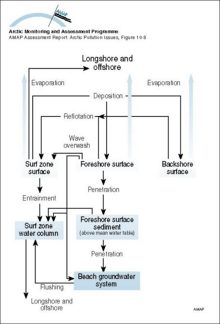
Mass transport pathways considered in the Coastal Zone Oil Spill Model (COZOIL), developed to simulate dynamic transport and weathering of oil on US Arctic coasts
|
|
|
Temporal variation in calculated reindeer Tag values for different Arctic regions
|

|
|
Spatial trends in the net flux from reindeer meat in different Arctic areas, for the first year after an assumed uniform deposition of 100 kBq/m2
|

|
|
Temporal variation in cow milk Tag values for Sweden, Norway and Finland
|

|
|
Comparison of the predicted flux of 137Cs in milk and reindeer meat in different Arctic areas, for the first year after an assumed uniform deposition of 100 kBq/m2
|

|
|
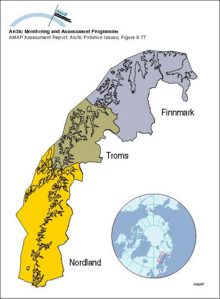
Norwegian counties considered in the flux vulnerability case study
|
|
|
Relative 137Cs output in foodstuffs from the different Arctic Norwegian counties in the first year after an assumed uniform deposition of 100 kBq/m2
|

|
|
The comparative importance of different foodstuffs as sources of 137Cs for the three Arctic Norwegian counties over the 1-year and 50-year period following an assumed uniform deposition of 100 kBq/m2
|

|
|
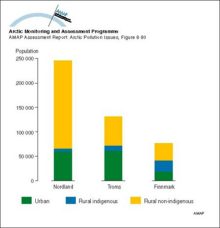
Distribution of the population of the three Arctic Norwegian counties
|
|
|
Scatterplots for comparisons between the average concentrations of SO2 and SO4 in air from October 1990 to December 1993 as monitored by the European Monitoring and Evaluation Programme (EMEP) and [..]
|

|
|
Calculated concentrations of SO2 and SO42- compared with measurements at Station Nord in northeastern Greenland
|

|

water OR waste searches for either of these words
oceans AND biodiversity searches for blocks with both words
pollution NEAR water searches for blocks with either of these words, with them being closer ranks higher
"climate change" searches for this phrase