|
Temporal variation in cow milk Tag values for Sweden, Norway and Finland
|

|
|
Time series of emissions of SO2 from European sources (Mylona 1993) and two major sources on the Kola Peninsula
|

|
|
The time series of (a) weekly-averaged non-seasalt (nss) sulfate aerosol at Alert, NWT, Canada, (b) monthly-averaged sulfate aerosol at Ny Ålesund, Norway, (c) weekly-averaged nitrate at Alert, and [..]
|

|
|
Emission rates of sulfur dioxide from Nikel together with annual average SO2 air concentrations measured at two sites in Norway (1978-1992)
|

|
|
Historical records of a) NO3- and b) SO42- concentrations from the Greenland icecap at Dye 3 c) A comparison of trends in the average SO42- and SO42- plus NO3- concentrations at Dye 3 in Greenland [..]
|

|
|
Calculated concentrations of SO2 and SO42- compared with measurements at Station Nord in northeastern Greenland
|

|
|
The time series of light scattering (?sp) and optical depth (?) at 500 nm at Barrow, Alaska
|

|
|
SMART model results for selected soil and lake output variables at Christmas lakes for the past 90 years and for three future scenarios assuming a 0%, 70% and 95% reduction of the present sulfur [..]
|

|
|
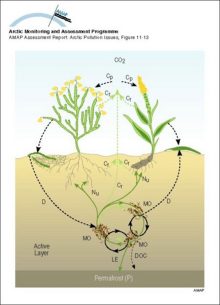
Schematic illustration of ecosystem carbon fluxes and nutrient circulation in the tundra Carbon and nutrient pathways are shown by dashed and continuous lines, respectively
|
|
|
History of snow accumulation in central Greenland during the most recent glaciation, as measured in the GISP2 core The 25-year running mean, represented in all panels, shows very large and rapid [..]
|

|
|
Trends in (annual average) ozone mixing ratio over Canada from 1980 to 1993
|

|
|
Illustration of the role of UV radiation in various light-dependent processes Natural UV radiation impacts the numbers, distribution and activity of several aquatic ecosystem targets and thus, [..]
|

|
|
Body burdens of radiocaesium (yearly averages) across the Canadian Arctic
|

|
|
Lower tropospheric temperatures since 1979, from satellite monitoring High variability is characteristic of the Arctic region due to its isolation from the moderating influences of warm, lower [..]
|

|
|
Monthly snow cover anomalies over northern hemispheric lands (including Greenland) between January 1972 and August 1995 Also shown are the 12-month running anomalies of hemispheric snow extent, [..]
|

|

water OR waste searches for either of these words
oceans AND biodiversity searches for blocks with both words
pollution NEAR water searches for blocks with either of these words, with them being closer ranks higher
"climate change" searches for this phrase