You are searching within the geographical region Norway.
Other related regions to search.
Your query returned 15 graphics.
Other related regions to search.
Your query returned 15 graphics.
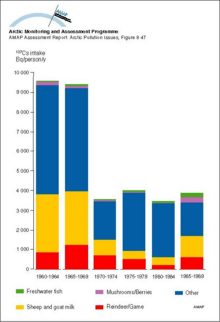
Yearly intake of 137Cs from various dietary components by the average population of Arctic NorwayYearly intake of 137Cs from various dietary components by the average population of Arctic Norway |
|
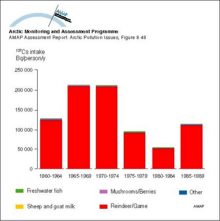
Yearly intake of 137Cs from various dietary components by the ‘selected’ population of Arctic NorwayYearly intake of 137Cs from various dietary components by the ‘selected’ population of Arctic Norway |
|
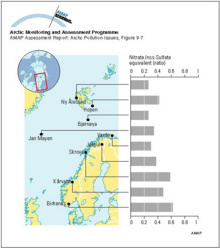
Variation of the nitrate to non-seasalt (nss) sulfate equivalent ratio in precipitation at Norwegian recording stations based on measurements between August 1982 and July 1984Variation of the nitrate to non-seasalt (nss) sulfate equivalent ratio in precipitation at Norwegian recording stations based on measurements between August 1982 and July 1984 |
|
The comparative importance of different foodstuffs as sources of 137Cs for the three Arctic Norwegian counties over the 1-year and 50-year period following an assumed uniform deposition of 100 kBq/m2The comparative importance of different foodstuffs as sources of 137Cs for the three Arctic Norwegian counties over the 1-year and 50-year period following an assumed uniform deposition of 100 kBq/m2 |

|
Relative 137Cs output in foodstuffs from the different Arctic Norwegian counties in the first year after an assumed uniform deposition of 100 kBq/m2Relative 137Cs output in foodstuffs from the different Arctic Norwegian counties in the first year after an assumed uniform deposition of 100 kBq/m2 |

|
Ozone soundings at Gardermoen, southern Norway, 27 January 1992 The green line denotes the partial pressure of ozone observed during the (type 1) anomaly, when low-ozone air passed over the areaOzone soundings at Gardermoen, southern Norway, 27 January 1992 The green line denotes the partial pressure of ozone observed during the (type 1) anomaly, when low-ozone air passed over the area |

|
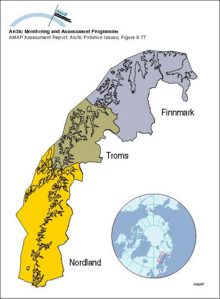
Norwegian counties considered in the flux vulnerability case studyNorwegian counties considered in the flux vulnerability case study |
|
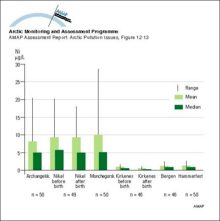
Nickel levels in urine from pregnant and delivering women in different areas of Russia and NorwayNickel levels in urine from pregnant and delivering women in different areas of Russia and Norway |
|
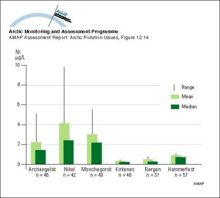
Nickel levels in urine from newborn children in different areas of Russia and NorwayNickel levels in urine from newborn children in different areas of Russia and Norway |
|
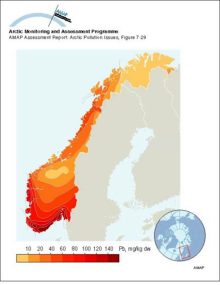
Lead concentrations in soil in Norway in 1975Lead concentrations in soil in Norway in 1975 |
|
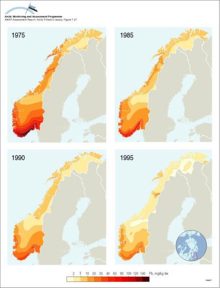
Latitudinal gradient of deposition of Pb in Norway in different years, as reflected by Pb concentrations in mossLatitudinal gradient of deposition of Pb in Norway in different years, as reflected by Pb concentrations in moss |
|
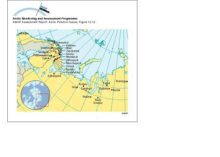
Human health study locations in Arctic Norway, Russia and Finland; red dots indicate the main communities studied under the AMAP monitoring programmeHuman health study locations in Arctic Norway, Russia and Finland; red dots indicate the main communities studied under the AMAP monitoring programme |
|
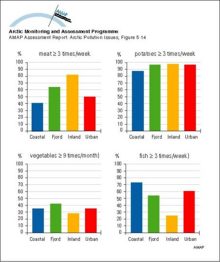
Frequency of consumption of food categories by Saami in Norway, percent of respondents, by society typeFrequency of consumption of food categories by Saami in Norway, percent of respondents, by society type |
|
Dose estimates based on wholebody measurements (see Figure 836) for two groups (northern Saami and southern Saami) of Norwegian reindeer-breeding SaamiDose estimates based on wholebody measurements (see Figure 836) for two groups (northern Saami and southern Saami) of Norwegian reindeer-breeding Saami |

|
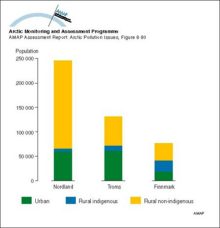
Distribution of the population of the three Arctic Norwegian countiesDistribution of the population of the three Arctic Norwegian counties |
|
