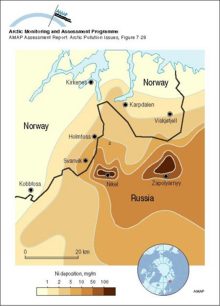
Model calculations of sulfur deposition and fraction of dry deposition for the period July 1990 to June 1991 in northern Fennoscandia and the Kola Peninsula
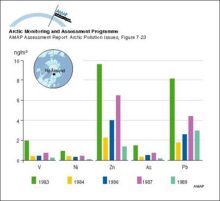
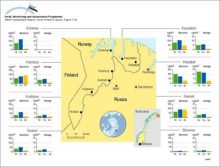
Average (15-month) and 24-h average maximum air concentrations of Ni, Cu and As measured at several stations in northern Norway near to major point sources on the Kola Peninsula
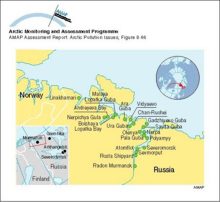
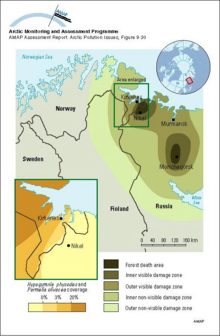
Approximate forest damage zones in the vicinity of Monchegorsk and Nikel and the visible-damage and non-visible-damage zones on the Kola Peninsula and Finnish Lapland The inset shows coverage (%) of [..]
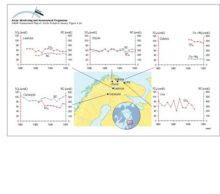
Annual average of sulfate and base cation concentrations as measured in rivers in northern Fennoscandia and the Kola Peninsula Note: SO4 (non-seasalt) estimated for river Utsjoki from total sulfur
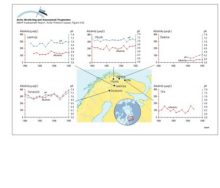
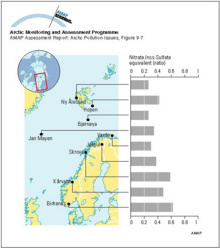
Variation of the nitrate to non-seasalt (nss) sulfate equivalent ratio in precipitation at Norwegian recording stations based on measurements between August 1982 and July 1984