You are searching within the geographical region Eurasia.
Other related regions to search.
Your query returned 84 graphics.
Results 61 - 75
Other related regions to search.
Your query returned 84 graphics.
Results 61 - 75
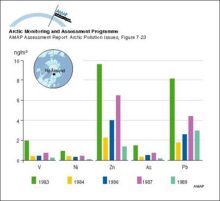
Atmospheric winter concentrations (median values) of metals measured in different years in the <25 µm aerosol fraction at Ny-Ålesund, SvalbardAtmospheric winter concentrations (median values) of metals measured in different years in the <25 µm aerosol fraction at Ny-Ålesund, Svalbard |
|
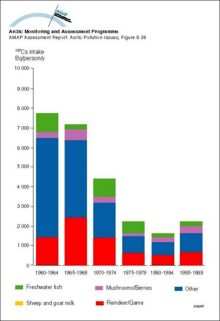
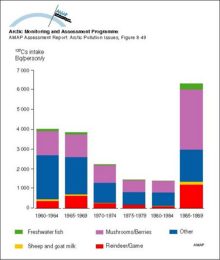
Yearly intake of 137Cs from various dietary components by the average population of Arctic FinlandYearly intake of 137Cs from various dietary components by the average population of Arctic Finland |
|
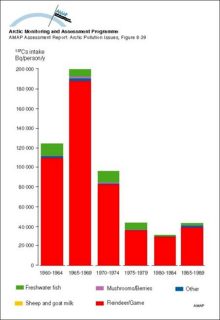
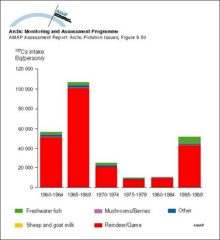
Yearly intake of 137Cs from various dietary components by the ‘selected’ population of Arctic FinlandYearly intake of 137Cs from various dietary components by the ‘selected’ population of Arctic Finland |
|
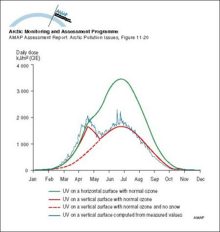
Theoretical clear day UV dose to horizontal and vertical surfaces, for Arctic FinlandTheoretical clear day UV dose to horizontal and vertical surfaces, for Arctic Finland |
|
Ozone soundings at Sodankylä, Finland, 23 March 1995 The green line denotes the profile of partial pressure of ozone observed during the (type 2) anomaly The red line shows the monthly mean ozone profile for MarchOzone soundings at Sodankylä, Finland, 23 March 1995 The green line denotes the profile of partial pressure of ozone observed during the (type 2) anomaly The red line shows the monthly mean ozone [..] |

|
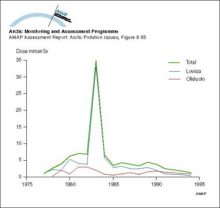
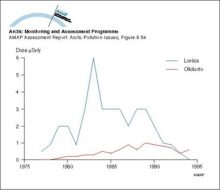
Collective doses from the Loviisa and Olkiluoto NPP’sCollective doses from the Loviisa and Olkiluoto NPP’s |
|
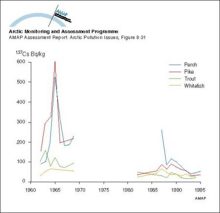
Changes with time in activity concentration of 137Cs in freshwater fish in Arctic FinlandChanges with time in activity concentration of 137Cs in freshwater fish in Arctic Finland |
|
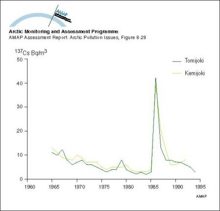
Changes with time in activity concentration of 137Cs in Finnish riversChanges with time in activity concentration of 137Cs in Finnish rivers |
|
Changes with time in 137Cs contamination in the food chain lichen - reindeer - humansChanges with time in 137Cs contamination in the food chain lichen - reindeer - humans |

|
Changes with time in 131I activity concentration in Finnish air samplesChanges with time in 131I activity concentration in Finnish air samples |
|
Annual radiation doses to critical groups from the Loviisa and Olkiluoto NPP’sAnnual radiation doses to critical groups from the Loviisa and Olkiluoto NPP’s |
|
Yearly intake of 137Cs from various dietary components by the average population of Arctic SwedenYearly intake of 137Cs from various dietary components by the average population of Arctic Sweden |
|
Yearly intake of 137Cs from various dietary components by the ‘selected’ population of Arctic SwedenYearly intake of 137Cs from various dietary components by the ‘selected’ population of Arctic Sweden |
|
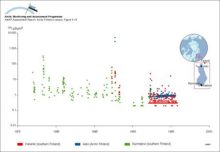
Temporal trends in PCB and DDT levels (µg/g lw ± 95% confidence limits) of otter muscle in Sweden Levels are based on means of 26, 16, and 28 samples (northern Sweden) and 29, 9, and 15 samples (southern Sweden)Temporal trends in PCB and DDT levels (µg/g lw ± 95% confidence limits) of otter muscle in Sweden Levels are based on means of 26, 16, and 28 samples (northern Sweden) and 29, 9, and 15 samples [..] |

|
Temporal trends in OC levels (ng/g lw) in reindeer from Abisko, Sweden Levels are usually based on a pool of 10 samplesTemporal trends in OC levels (ng/g lw) in reindeer from Abisko, Sweden Levels are usually based on a pool of 10 samples |

|
