You are searching within the geographical region Europe and Central Asia.
Other related regions to search.
Your query returned 78 graphics.
Results 46 - 60
Other related regions to search.
Your query returned 78 graphics.
Results 46 - 60
Ozone soundings at Sodankylä, Finland, 23 March 1995 The green line denotes the profile of partial pressure of ozone observed during the (type 2) anomaly The red line shows the monthly mean ozone profile for MarchOzone soundings at Sodankylä, Finland, 23 March 1995 The green line denotes the profile of partial pressure of ozone observed during the (type 2) anomaly The red line shows the monthly mean ozone [..] |

|
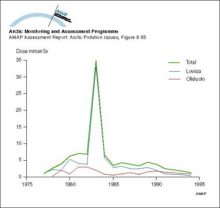
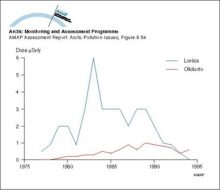
Collective doses from the Loviisa and Olkiluoto NPP’sCollective doses from the Loviisa and Olkiluoto NPP’s |
|
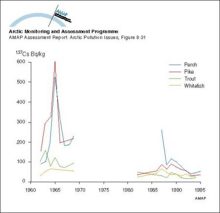
Changes with time in activity concentration of 137Cs in freshwater fish in Arctic FinlandChanges with time in activity concentration of 137Cs in freshwater fish in Arctic Finland |
|
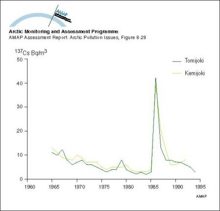
Changes with time in activity concentration of 137Cs in Finnish riversChanges with time in activity concentration of 137Cs in Finnish rivers |
|
Changes with time in 137Cs contamination in the food chain lichen - reindeer - humansChanges with time in 137Cs contamination in the food chain lichen - reindeer - humans |

|
Changes with time in 131I activity concentration in Finnish air samplesChanges with time in 131I activity concentration in Finnish air samples |
|
Annual radiation doses to critical groups from the Loviisa and Olkiluoto NPP’sAnnual radiation doses to critical groups from the Loviisa and Olkiluoto NPP’s |
|
Transport of 90Sr, originating from Sellafield, along the coast of Norway The highest values are found in the Norwegian Coastal Current and decrease northwardTransport of 90Sr, originating from Sellafield, along the coast of Norway The highest values are found in the Norwegian Coastal Current and decrease northward |

|
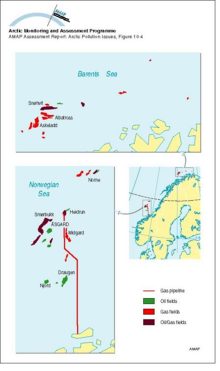
Oil and gas development areas in the Norwegian Sea and Norwegian Barents Sea regionsOil and gas development areas in the Norwegian Sea and Norwegian Barents Sea regions |
|
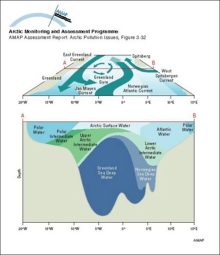
Schematic diagrams of the Greenland Sea showing the surface circulation (above) and water mass structure at a section across the central gyre (below)Schematic diagrams of the Greenland Sea showing the surface circulation (above) and water mass structure at a section across the central gyre (below) |
|
Composition of particles measured at different altitudes during winter flights in the Norwegian ArcticComposition of particles measured at different altitudes during winter flights in the Norwegian Arctic |

|
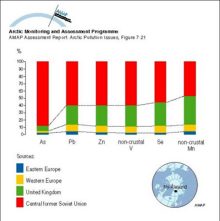
Average regional source apportionment of metals in winter aerosol at Ny-Ålesund, Svalbard from Europe and the central part of the former Soviet Union (including the Urals and Norilsk)Average regional source apportionment of metals in winter aerosol at Ny-Ålesund, Svalbard from Europe and the central part of the former Soviet Union (including the Urals and Norilsk) |
|
Average contributions from various sources to the atmospheric concentrations of elements in winter air samples at Ny-Ålesund, SvalbardAverage contributions from various sources to the atmospheric concentrations of elements in winter air samples at Ny-Ålesund, Svalbard |

|
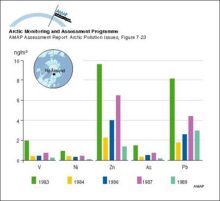
Atmospheric winter concentrations (median values) of metals measured in different years in the <25 µm aerosol fraction at Ny-Ålesund, SvalbardAtmospheric winter concentrations (median values) of metals measured in different years in the <25 µm aerosol fraction at Ny-Ålesund, Svalbard |
|
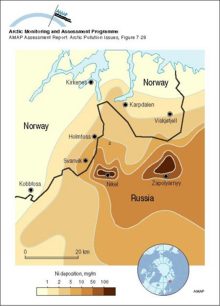
Nickel deposition to snow on the Kola Peninsula in April 1990Nickel deposition to snow on the Kola Peninsula in April 1990 |
|
