|
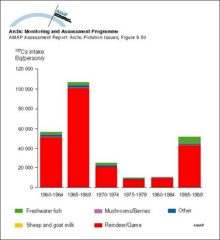
Yearly intake of 137Cs from various dietary components by the ‘selected’ population of Arctic Sweden
|
|
|
Temporal trends in PCB and DDT levels (µg/g lw ± 95% confidence limits) of otter muscle in Sweden Levels are based on means of 26, 16, and 28 samples (northern Sweden) and 29, 9, and 15 samples [..]
|

|
|
Temporal trends in OC levels (ng/g lw) in reindeer from Abisko, Sweden Levels are usually based on a pool of 10 samples
|

|
|
Temporal trends in levels of PCB, DDT, alpha-HCH, and HCB in muscle from Lake Storvindeln pike and Lake Abiskojaure char in Sweden Mean levels (µg/g lw) and 95% confidence intervals of the mean are [..]
|

|
|
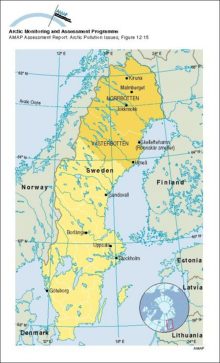
Map of Sweden showing locations mentioned in the text; Arctic areas comprise the two northernmost counties, Norrbotten and Västerbotten
|
|
|
Levels of PCB congeners and PCDD/Fs (ng/g lw) in Lake Storvindeln pike muscle between 1968 and 1992
|

|
|
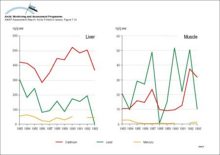
Changes with time in concentrations of Cd, Pb and Hg in liver and muscle tissue of reindeer (Rangifer tarandus) sampled in three districts in eastern Sweden
|
|
|
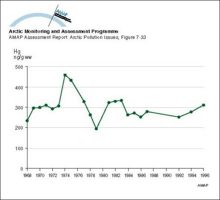
Changes with time in (weight adjusted, geometric mean) concentrations of Hg in muscle tissue of pike (Esox lucius) in Sweden
|
|
|
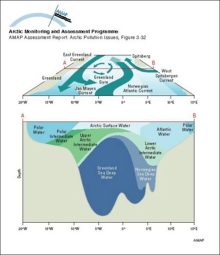
Schematic diagrams of the Greenland Sea showing the surface circulation (above) and water mass structure at a section across the central gyre (below)
|
|
|
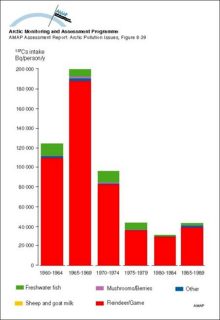
Yearly intake of 137Cs from various dietary components by the average population of Arctic Finland
|
|
|
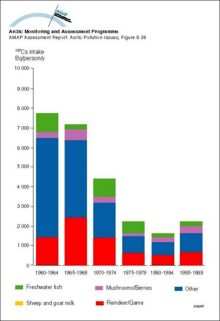
Yearly intake of 137Cs from various dietary components by the ‘selected’ population of Arctic Finland
|
|
|
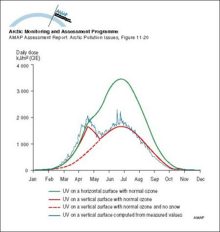
Theoretical clear day UV dose to horizontal and vertical surfaces, for Arctic Finland
|
|
|
Ozone soundings at Sodankylä, Finland, 23 March 1995 The green line denotes the profile of partial pressure of ozone observed during the (type 2) anomaly The red line shows the monthly mean ozone [..]
|

|
|
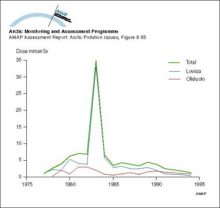
Collective doses from the Loviisa and Olkiluoto NPP’s
|
|
|
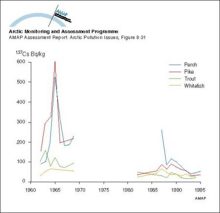
Changes with time in activity concentration of 137Cs in freshwater fish in Arctic Finland
|
|
