PCB concentrations in fish muscle
|
|||
Key message
sPCB concentrations show significant declining trends in the investigated biotic matrices as a result of measures taken to reduce discharges of PCB to the environment. The concentrations are still significantly higher in the Baltic Proper and in the southern Bothnian Sea compared to the Kattegatt and the Skagerakk.
Results and assessments
Relevance of the indicator for describing developments in the environment
PCB concentration in tissues from various species show coherent trends of similar magnitudes from various regions. The investigated species are commonly used for human consumption.
Policy relevance and policy references
The Helsinki Convention (HELCOM) revised 1992 especially names PCB for which special bans and restrictions on transport, trade, handling, use and disposal are imposed. The Minister Declaration from 1988, within HELCOM, calls for a reduction of stable organic substances by 50% by 1995 with 1987 as a base year. The Minister Declaration from 1996, within HELCOM, and the declaration in Esbjerg 1995, calls for measures for toxic, persistent, bioackumulating substances to have ceased completely in the year 2020.
Assessment
The concentration of sPCB (sum of PCB’s estimated from CB-138 or peak 10 from packed column chromatography) in herring muscle from all herring sites in the Baltic show significant decreasing trends during the time period 1978/80-2002. The rates vary between 4.1 and 9.7% per year. This implies a total decrease of about 80% at Ängskärsklubb and about 60% at Karlskrona, of the PCB-concentration in herring muscle, since the end of the seventies.
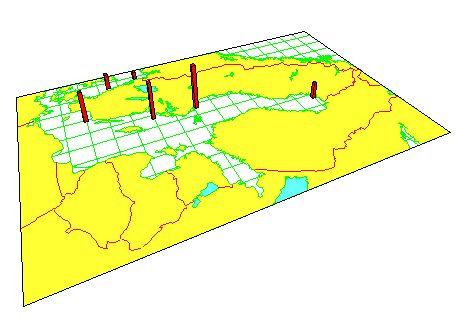
Figure 1. Spatial variation in concentration (lipid weight.) of CB-153 in herring muscle (2002). The highest concentration (147 ng/g) was found in the southern Bothnian Sea, the lowest (26 ng/g) in the Skagerrack
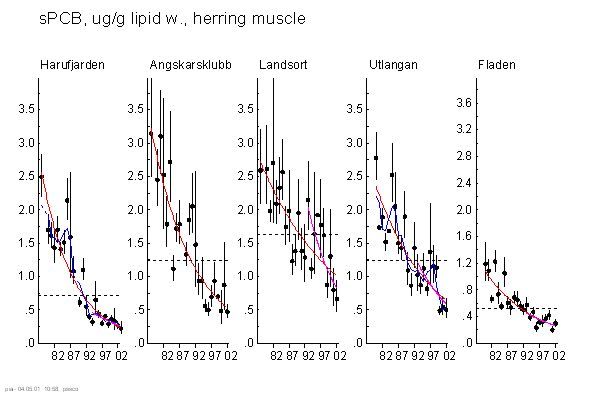
Figure 2. Temporal trends of sPCB concentration (ug/g lipid) in herring muscle.
The two cod liver time-series from south east of Gotland in the Baltic Proper and Fladen at the west coast, show significant decreasing trends of sPCB at the rate of 7.5 and 6.1% per year respectively (1980-2002).
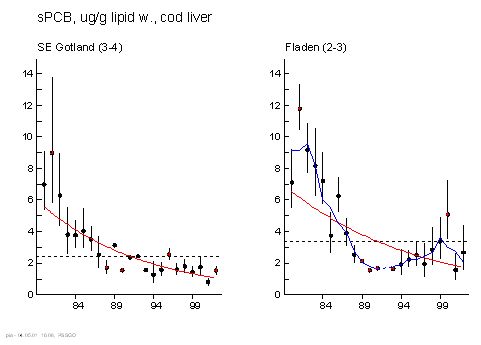
Figure 3. Temporal trends of sPCB concentration (ug/g lipid) in cod liver.
References
Bignert, A., Asplund L. and Willander A. 2003. Comments Concerning the National Swedish Contaminant Monitoring Programme in Marine Biota. Rapport till Naturvårdsverket, 2004-04-30. 135 pp.
Data
Geometric concentrations of sPCB (mg/g lipid weight) in various matrices and sites during the time period 1980-1997 and the estimated mean concentration for the last year. The age interval for fish, and the length interval for blue mussels are also presented together with the total number of analyses and the number of years of the various time-series.
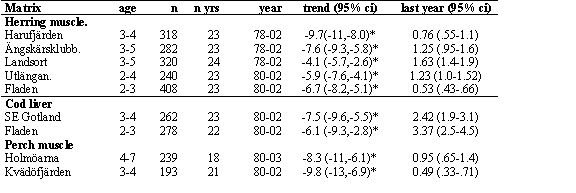
*significant trend, p < 0.05
Metadata
Technical information
Data source: The National Swedish Monitoring Program of Contaminants in Biota.
Sampling, sample preparation, storage in specimen bank and evaluation of results are carried out by the Contaminant Research Group at the Swedish Museum of Natural History, Stockholm. Chemical Analysis is carried out at Institute of Applied Environmental Research at Stockholm University.
Geographical coverage: see data table and map.
Temporal coverage: see data table and figures.
Methodology and frequency of data collection: see Bignert et al, 2004
Methodology of data manipulation: For a detailed description of statistical methods use, see Bignert et al. 2004.
Quality information
The number of years required to detect an annual change of 5% with a power of 80% varied between 15 to 16 years for the herring time-series. The number of years required to detect an annual change of 5% was 17 and 22 years for the two cod time-series.
