Temporal development of Baltic coastal fish communities and key species
|
||||
Key message
Coastal fish community indicators show few significant temporal changes during the period 1996–2005. As no consistent trends were observed within any of the sub-basins, the observed temporal changes in some areas are mainly related to local impact. Despite the lack of consistency, high water temperatures during growth seasons in recent years have possibly affected the fish communities in the Bothnian Sea. This is reflected as an increased recruitment success and/or increased individual growth rate of dominating, warm water dwelling, species, e.g. perch (Perca fluviatilis) and roach (Rutilus rutilus). A significant impact of temperature on the coastal fish is supported by the consistent trends in some key species indicators that were observed in both Bothnian Sea and western Baltic Proper. Effects of changes in exploitation rate were observed in Gulf of Riga and in southern Baltic Proper. In the former area a high exploitation rate of piscivorous fish during mid 1990’s was clearly recognised. In the latter area, flounder (Platichthys flesus), the key species for the southern Baltic Proper, has increased during the period possibly due to population recovery after a previous high exploitation rate. Local indicator fact sheets, with more specific sub regional information, can be accessed via table 3 below.
Results and assessments
Relevance of the indicators for describing developments in the environment
Fish community
Number of species, separated into freshwater and marine species (migratory species are classified into freshwater or marine species according to reproduction habitat)
The number of species caught depends on several factors such as salinity, habitat heterogeneity, temperature and exposure of the area sampled. Species richness also depends on the number of efforts used in the sampling, as the probability to catch a species increases with increased number of efforts and size of the sampled area. Number of species usually decreases with decreasing salinity as marine species disappear and the fish communities become more dominated by freshwater species.
Total biomass
Total biomass is used as an index of the size of the standing stock. Increased biomass indicates increased nutritional conditions and production potential, whereas decreased biomass indicates the opposite. Fishing pressure may also affect the total biomass. Total biomass, expressed as weight per unit effort (WPUE, kg), is estimated from actual biomass figures or calculated from number of caught fish per length group in the length distribution.
Species diversity
Shannon Wiener index reflects the species richness and equitability of the community. Increasing values indicate increasing diversity, caused by a high number of species with even proportion in the catch. Decreasing values indicate low diversity with few dominating species and a community with a small number of species. Calculations are based on the biomass proportion of each species.
Slope of size spectrum
Slope of size spectrum reflects the length distribution of the fish community. Recruitment variability, extensive size selective fishing, as well as change in species composition in the fish community could affect the slope. Decreasing values indicate a development towards smaller individuals.
Average trophic level of catch
Average trophic level of a fish community reflects both size structure and food web composition. Decreasing values indicate that the proportion of species at higher trophic levels, e.g., piscivorous fish, decreases and that the fish community is largely composed of plankton- and benthos-feeding species. The average trophic level also reflects environmental and anthropogenic pressures such as fishery. The trophic level of coastal fish communities was calculated based on the annual weight per unit effort (WPUE) for each species and area, adjusted by species-specific values for trophic level according to Fishbase (2004).
Key species
Species biomass
Species biomass is an index of the size of the standing stock. Biomass changes reflect changes in external driving forces such as productivity, temperature and fishery, as well as changes in interspecific interactions among species. Total biomass, expressed as weight per unit effort (WPUE, kg), is estimated from actual biomass figures or calculated from number of caught fish per length group in the length distribution.
Mean age
Mean age of a species reflects the age distribution in the stock. It is affected by reproductive success and mortality rate (fishing pressure and predation).
Mortality
Mortality is expressed as percent annual decrease for each year of sampling, based on the mortality of individuals that are 3-7 year old. Increased mortality indicates increased fishing, predation or mortality due to other causes.
Mean length
Mean length reflects the length distribution in the fish stock and is affected by variation in recruitment, extensive size selective fishing and/or changed individual growth rate.
Slope of size spectrum
Slope of size spectrum reflects the length distribution of the fish population and is affected by e.g. recruitment success and/or size selective fishing. A steep negative slope indicates presence of few large individuals, while a flat negative slope indicates occurrence of high number of large individuals in relation to small individuals.
Policy relevance and policy references
Coastal fish is a self-sustaining natural resource, which is important for economical, recreational and biodiversity purposes. The self-sustaining capability may be jeopardized by different human activities and global changes, which is why regular assessments of coastal fish communities and stocks are necessary to produce. ICES have during a long time made assessments for the Baltic off shore species Baltic herring (Clupea harengus), cod (Gadus morhua) and sprat (Sprattus sprattus).
Assessment
Coastal fish community
Bothnian Bay, Bothnian Sea, Archipelago Sea
There were no consistent temporal variations in the applied indicators in any of the three basins. Species diversity increased as a result of a shift from two dominating species, perch and roach, to three dominating species, perch, roach and bream (Abramis brama) in the northernmost area, Råneå. Only one marine species, Baltic herring, is common at Holmön outer and the significant increase of marine species resulted from a more frequent occurrence of three-spined stickleback (Gasterosteus aculeatus) at the end of the period. At Forsmark, total biomass decreased due to reduced catches of perch and roach, while the slope of size spectrum increased due to larger catches of bream and an increased growth rate of perch, following high temperature during growth season in recent years. In the adjacent area Finbo, an increased total biomass and reduced slope of size spectrum may reflect an increased productivity and/or a high temperature in the area. High mean temperature over the growth season also generates strong year classes and enhanced growth. The decrease in number of species, both freshwater and marine species, and species diversity at Finbo possibly relates to that few individuals of some rarely caught species generated high numbers of species at an early stage of the analysed time series, resulting in a decreasing number of species and species diversity over time. The number of marine species decreased at Brunskär, indicating a shift towards more freshwater conditions.
Gulf of Riga, Eastern Baltic Proper
High exploitation of piscivorous fish in the northern Gulf of Riga (Hiiumaa) resulted in weak populations of perch during mid 1990’s. The population has since then recovered, which caused an increased trend in average trophic level. The increased trend of trophic level at Daugavgriva north is caused by strong year-classes of perch and pikeperch. Despite that, trophic levels are low and indicate a low proportion of piscivorous fish, which are the main target of the coastal fishery. The decrease in number of marine species at Jurkalne is a result of occurrence of few individuals of rarely caught species at the beginning of the analysed time series, resulting in a decreasing number of marine species over time. The only marine species, three-spined stickleback, found in the Curonian lagoon Atmata appeared only in the last years of the sampling period, causing a significant increase of the number of marine species.
Western Baltic Proper, Southern Baltic Proper
The only significant trend observed was an increase in number of freshwater species at Poland ICES 24/25 indicating a shift towards more freshwater conditions.
Table 1. Indicators for coastal fish communities 1996-2005

Key species, perch or flounder
Bothnian Bay, Bothnian Sea, Archipelago Sea
A consistent trend in one indicator was found among the two areas in the Bothnian Sea. Slope of size spectrum of perch increased both at Forsmark and in Finbo, indicating an increasing proportion of large perch. This could be due to an increased individual growth rate of perch, an effect of a high temperature during growth season in recent years. At Finbo, also biomass and mean length increased, indicating increased productivity and/or increased growth rate and strong year-classes due to increased mean temperature. The decrease of mean age of perch at Brunskär is probably caused by a decrease in the proportion of old perch, although natural variation in year-class strength also may contribute.
Gulf of Riga, Eastern Baltic Proper
Increased biomass of the key species perch at Daugavgriva north is caused by several strong year-classes in recent years. If fishing pressure remains on the same high level, the abundance of perch most probably will decrease again.
Western Baltic Proper, Southern Baltic Proper
Mean age decreased consistently in the areas in Western Baltic Proper. This could partly be the result of a higher proportion of young individuals in the catches due to increased growth rate and to strong year-classes in recent years. At Vinö also decreasing mean length and slope of size spectrum indicate a shift towards smaller individuals. A contradicting trend was found at Kvädöfjärden, where slope of size spectrum increased probably due to increased growth rate. In southern Baltic Proper, the biomass of flounder increased over time in both sampled areas. This development possibly reflects a population recovery after that the high exploitation of the species in 1980’s ceased.
Table 2. Indicators for key species 1996-2005

References
Fishbase, 2004. R. Froese, and D. Pauly (Eds) 2004. World Wide Web electronic publication. www.fishbase.org. version (12/2004).
Ljunggren, L., A. Sandström, G. Johansson, G. Sundblad and P. Karås, 2005. Rekryteringsproblem hos Östersjöns kustfiskbestånd. Finfo, 2005:5. (in Swedish with English summary).
Thoresson, G. 1996. Guidelines for coastal fish monitoring – fishery biology. Kustrapport 1996:2.
Ådjers, K., M. Appelberg, R. Eschbaum, A. Lappalainen, A. Minde, Rimantas Repečka and G. Thoresson, 2006. Trends in coastal fish stocks of the Baltic Sea. Bor. Environ. Res. 11: 13-25.
Data
Data on coastal fish communities are collected by annual test fishing with gill nets in the coastal zone. The test fishing is carried out in August and target species are demersal species large enough to be caught in gill nets. Data is provided by the Estonian Marine Institute, University of Tartu; Finnish Game and Fisheries Research Institute, Helsinki University; Institute of Ecology, Vilnius University, Lithuania; Latvian Fish Resources Agency; Provincial Government of Åland Islands and the Swedish Board of Fisheries. The data host is the Coordination Organ of Baltic Reference Areas (COBRA), located at the Provincial Government of Åland Islands.
Metadata
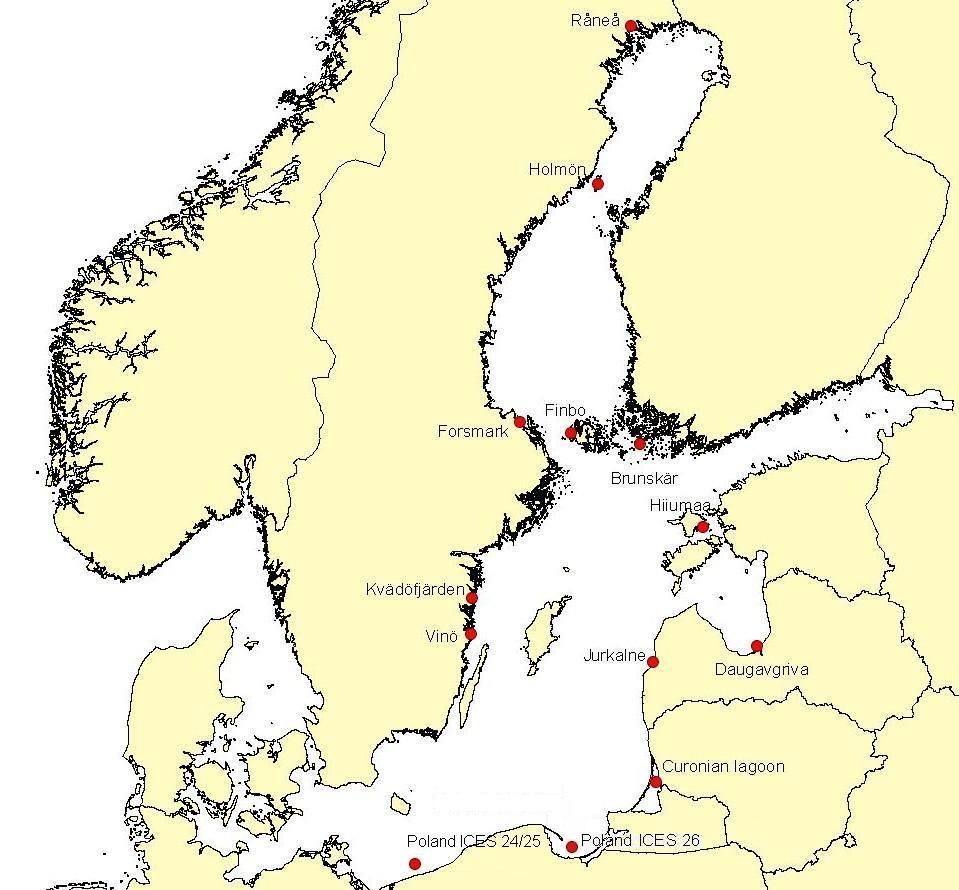
Eleven areas, some divided into two different sub areas, are investigated annually on long-term basis using multi mesh sized gillnets. Two more areas are on a similar basis investigated with trawl surveys. Five indicators on coastal fish community level and five on key species level have been evaluated.
Table 3. Presentation of areas, gear used and key species studied. Note: To access local indicator fact sheets, click on the area links.
| Basin | Area | Gear | Key species |
| Bothnian Bay | Råneå | Coastal survey nets | Perch (Perca fluviatilis) |
| Holmön (inner/outer) | Coastal survey nets | Perch (Perca fluviatilis) | |
| Bothnian Sea | Forsmark (inner/outer) | Coastal survey nets | Perch (Perca fluviatilis) |
| Finbo | Coastal survey nets | Perch (Perca fluviatilis) | |
| Archipelago Sea | Brunskär | Coastal survey nets | Perch (Perca fluviatilis) |
| Gulf of Riga | Hiiumaa (inner/outer) | Net series | Perch (Perca fluviatilis) |
| Daugavgriva (north/south) | Net series | Perch (Perca fluviatilis) | |
| Eastern Baltic Proper | Jurkalne | Net series | Flounder (Platichthys flesus) |
| Curonian lagoon (Atmata/Dreverna) | Net series | Perch (Perca fluviatilis) | |
| Western Baltic Proper | Kvädöfjärden (inner/outer) | Net series | Perch (Perca fluviatilis) |
| Vinö | Net series | Perch (Perca fluviatilis) | |
| Southern Baltic Proper | Poland (26, 24/25) | Trawl | Flounder (Platichthys flesus) |
Figure 1. Map over the Baltic Sea and sampled areas. Click image to enlarge.
Other interesting information
The HELCOM Coastal Fish Monitoring Expert Group has compiled information about the presence and abundance of certain fish species at coastal fish monitoring stations during 2001-2006. Respective maps can be viewed by clicking the species names:
Species presented in the presence maps:
Asp (Aspius aspius)
Baltic herring (Clupea harengus)
Barbel (Barbus barbus)
Bleak (Alburnus alburnus)
Flounder (Platichthys flesus)
Gudgeon (Gobio gobio)
Pike (Esox lucius)
Smelt (Osmerus eperlanus)
Sprat (Sprattus sprattus)
Species presented in the abundance maps:
Bream (Abramis brama)
Crucian carp (Carassius carassius)
Dace (Leuciscus leuciscus)
Ide (Leuciscus idus)
Perch (Perca fluviatilis)
Pikeperch (Sander lucioperca)
Prussian carp (Carassius gibelio)
Roach (Rutilus rutilus)
Rudd (Scardinius erythrophthalmus)
Ruffe (Gymnocephalus cernuus)
Tench (Tinca tinca)
Vimba bream (Vimba vimba)
White bream (Blicca bjoerkna)
Click here for background information about the methodology and data used in the maps.
More information about coastal fish monitoring in the Baltic Sea region is available in the Coastal fish monitoring GIS interactive map.
For reference purposes, please cite this indicator fact sheet as follows:
[Author’s name(s)], [Year]. [Indicator Fact Sheet title]. HELCOM Indicator Fact Sheets 2006. Online. [Date Viewed], http://www.helcom.fi/environment2/ifs/en_GB/cover/.
Last updated: 16.3.2007


