Temporal and spatial variation of dissolved nutrients and chlorophyll a in the Baltic Sea in 2006

|
||||
Key message
![]()
The chlorophyll a concentrations during 2006 followed closely the Alg@line-reference (the average of the years 1993-2005) conditions (Alg@line results).
![]()
The chlorophyll a concentration exceeded 3mg m-3 for more than 60 % of the days on the summer period (June-September) in the Arkona, Bornholm, Easter Gotland and Northern Gotland Basins and Gulf of Riga and Finland (BalEco results).
![]() The Alg@line winter surface water concentrations of dissolved inorganic phosphate were higher than the Alg@line-reference and the HELCOM acceptable deviation in all regions. (Alg@line results)
The Alg@line winter surface water concentrations of dissolved inorganic phosphate were higher than the Alg@line-reference and the HELCOM acceptable deviation in all regions. (Alg@line results)
![]() According to the HELCOM acceptable deviation and BalEco model results all Baltic Sea open sea regions - are again classified as an eutrophication problem areas in the year 2006.
According to the HELCOM acceptable deviation and BalEco model results all Baltic Sea open sea regions - are again classified as an eutrophication problem areas in the year 2006.
Results and assessment
Relevance of the indicator for describing developments in the environment
The Baltic Sea is strongly affected by seasonality: during the winter the water is rich in nutrients, but as long as the surface water stratification remains weak and the availability of light is limited, the phytoplankton biomass remains low. As the surface water stratifies and the amount of light increases, the biomass of phytoplankton increases massively during a short spring period. When the dissolved nitrogen is depleted from the surface water the algal biomass decreases significantly. The amount of phosphate left over varies between the years. When the sea water warms up during the summer, the blue-green algae become more common utilizing the surplus phosphate. The occasional upwellings of deeper, nutrient rich water can stimulate the algal growth.
The amount of nutrients together with temperature variation and the amount of light form the basis for phytoplankton succession. Nutrients as such indicate the level of eutrophication in a sea basin. Chlorophyll a concentration is a relative measure of phytoplankton biomass in the water. Since high nutrient concentrations increase the intensity and frequency of phytoplankton blooms, chlorophyll a can be used as an indicator of the eutrophication level in a sea basin.
Policy relevance and policy references
Nutrients and their ratios form the preconditions for harmful algal blooms as well as the overall eutrophication. The standard HELCOM COMBINE program samples the Baltic Sea several times a year. However, seasonal processes change the state of the Baltic Sea between the different COMBINE samplings in ways that need to be mapped with other methods. The combination of Alg@line monitoring and ecosystem models reveal the short-term fluctuations in the Baltic environment.
The reference and target levels are of great importance when interpreting the state of the sea. The comparison with averages of the years 1993-2005 (Alg@line-reference) represents deviation of this year from the present state of the Baltic Sea. The comparison with the tentative reference and acceptable deviation levels by HELCOM, (2006), shows the deviation from the goals specified by HELCOM and the state of the Baltic Sea before 1950s. The Table 1 in Metadata shows the tentative HELCOM reference and acceptable deviation values that were used in this analysis.
Assessment: First sight by Algaline measurements-The state of the year 2006 compared to HELCOM reference and acceptable deviation levels and Alg@line-reference values.
In 2006 the winter surface water concentrations of dissolved inorganic phosphate (DIP) were higher than both the HELCOM acceptable deviation level and Alg@line-reference values in all regions (in Fig.1, left).
The winter surface water concentrations of the dissolved inorganic nitrogen (DIN) were under the acceptable deviation only in Arkona Basin. In Bornhom Basin, Eastern Gotland Basin and Northern Gotland Basin the winter concentrations were higher than acceptable deviation level, but lower than Alg@line-reference values. In the Gulf of Finland the winter DIN concentrations were higher than both acceptable deviation and Alg@line-reference (in Fig. 1, right).
The winter surface water DIN:DIP ratio was lower than Alg@line-reference in all regions (in Fig. 2, left).
Also the winter surface water ratio of DIN:silicate was lower than Alg@line-reference in all regions except Gulf of Finland (in Fig 2, right).
The summer surface water chlorophyll a concentrations were widely fluctuating. The acceptable deviation and Alg@line-reference levels were exceeded in all regions. In Arkona Basin, Bornholms Basin and Eastern Gotland Basin part of the summer the values were below the acceptable deviation level (in Fig. 3)
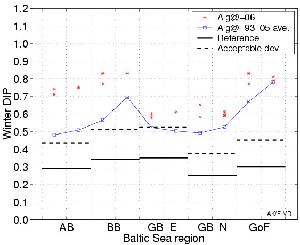 | 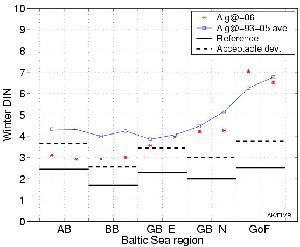 |
Figure 1. The open sea winter concentrations of dissolved inorganic phosphate (PO4 µmol l-1) and dissolved inorganic nitrogen ( NO3+NO2+NH4) in different Baltic Sea regions. The year 2006 Alg@line measurements (= red stars) compared to the Alg@line mean values of the years 1993-2005 ( = blue signs) and to HELCOM-reference and –acceptable deviation values ( = black lines). Values are presented from two locations per sea region, shown in Fig. 16. Click images to enlarge!
Baltic Sea regions: AB= Arkona Basin, BB=Bornholm Basin, GB_E= Eastern Gotland Basin, GB_N=Northern Gotland Basin, GoF=Gulf of Finland.
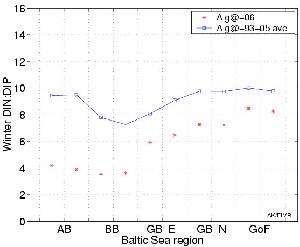 | 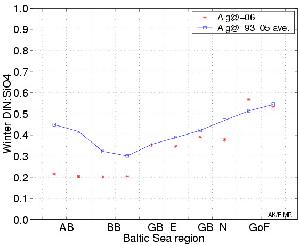 |
Figure 2. Idem, but ratio of DIP and DIN (left) and ratio of DIN and silicate (right). Click images to enlarge!
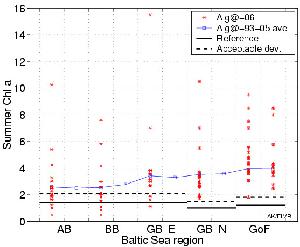
Figure 3. Idem, but summer chlorophyll a concentrations. Click image to enlarge!
Assessment: Baltic Proper (Alg@line observations)
Daily comparison between Alg@line 2006 measurements and Alg@line 1993-2005 averages shows that nutrient and Chl a variations in 2006 were close to average variations. Click link for further information.
Assessment: First sight by BalEco model results - Scaled model results of seasonal averages and part of summerdays of chlophyll a.
The modeled concentrations of nutrients and chlorophyll were scaled with the reference conditions and the acceptable deviation values. The resulting indicator pi was defined for concentration Ci as
pi=(Ci-Ri)/(ADi-Ri)
where Ri is the HELCOM (2006) reference and ADi is the acceptable deviation level. Values < 1 are within the acceptable deviation, whereas values > 1 are higher than acceptable deviation. Values between 0-1 are between reference conditions and acceptable deviation and values under 0 are under reference conditions. HELCOM reference levels and acceptable deviation levels are presented in Table 1 in Metadata section.
HELCOM (2006) classification of the state of marine environment is based on the “one out, all out” principle, which means that if one of the examined variables excess the acceptable deviation the sea area is classified as an eutrophication problem area. To be a non-eutrophication problem area all variables examined should be within the limits of the acceptable deviation (in scaled figures values should be under 1).
At least one of the variables DIN, DIP or Chl a exceeded the acceptable deviation values in all sea regions in the Baltic Sea in 2006. That defines that all regions of the Baltic Sea were eutrophication problem areas.
In the BalEco results the winter (January-February) mean DIP exceeded the acceptable deviation level in the Arkona Basin , Bornholm Basin , Western Gotland Basin , South East Gotland Basin, Lithuanian open waters, Gdansk Deep, Northern Gotland Basins, and in the Gulfs of Riga and Finland (in Fig 10, left).
The winter mean DIN exceeded the acceptable deviation in the Northern Gotland Basin, Gulf of Finland, Bothnian Bay, Bothnian Sea and partly in Bornholm Basin (in Fig. 10, right).
The summer mean Chl a exceeded the acceptable deviation in all regions except Bothnian Bay and Lithuanian open waters (in Fig 11, left).
The Chlorophyll a concentration exceeded 3mg m-3 for more than 60 % of the days on the summer period (June-September) in the Arkona, Bornholm, Easter Gotland and Northern Gotland Basins and Gulf of Riga and Finland (in Fig 11, right). The 3mg m-3 amount of Chlorophyll a in water mass is agreed to be a limit for bloom.
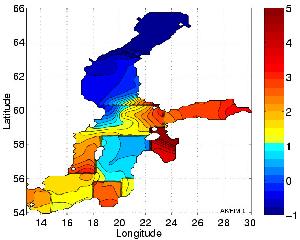 | 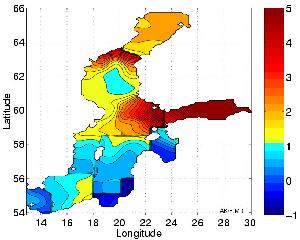 |
Figure 10. DIP (left), DIN (right) scaled surface winter average concentrations. BalEco™ ecosystem model results. Click image to enlarge!
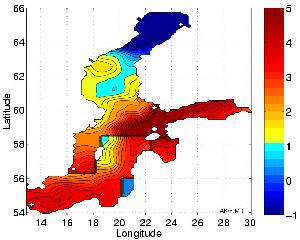 | 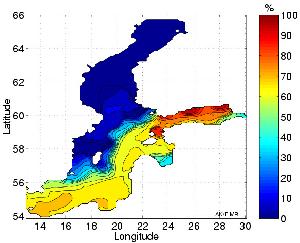 |
Figure 11. Scaled Chl a summer average concentrations (left). The prosentage days of summer when Chl a exceeds 3mg m-3 (right). BalEco™ ecosystem model results. Click image to enlarge!
Assessment: Baltic Sea winter/summer average (BalEco™ model)
The average concentrations used in scaled figures above are presented under this link, where the nutrient ratios are also presented. The average of wintertime surface layer DIN/DIP ratio presented in Fig. 6 exceeds the HELCOM reference level (Redfield-ratio) in the Bothnian Bay, Bothnian Sea and Gulf of Finland. The winter mean DIN/SiO4 –ratio exceeds HELCOM reference level (1) only in the eastern Gulf of Finland (Fig. 7). Click link for further information.
Assessment: Bothnia Sea (BalEco™ model)
The transect along Bothnian Sea surface water (transect marked in Fig. 22 in Metadata section) shows daily variability. Click link for further information.
Assessment: Depth-dependence on the Alg@line route (BalEco™ model)
The entrance of the Gulf of Finland and the Gotland Basin deep are compared in vertical sections. Click link for further information.
Acknowledgements
This work is partly founded by the Nordic Council of Ministers (BANSAI project) and the ESA GSE project MARCOAST.
Reference
Helcom, 2006. Development of tools for assessment of eutrophication in the Baltic Sea. Balt. Sea Environ. Proc. No. 104.
Metadata
Click link to access metadata
For reference purposes, please cite this indicator fact sheet as follows:
[Author’s name(s)], [Year]. [Indicator Fact Sheet title]. HELCOM Indicator Fact Sheets 2007. Online. [Date Viewed], http://www.helcom.fi/environment2/ifs/en_GB/cover/.
Last updated: 3.10.2007
