Ecosystem regime state in the Baltic Proper, Gulf of Riga, Gulf of Finland, and the Bothnian Sea

|
||||
Key message:
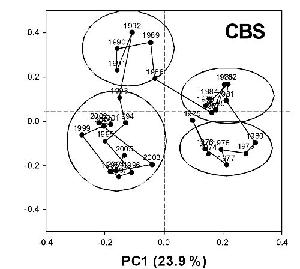
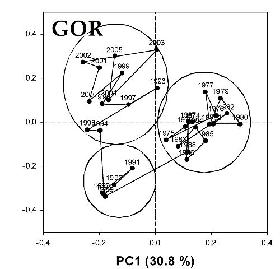
- Distinct regimes in ecosystem structure were detected in the four Baltic subsystems analyzed (Fig. 1)
- Regime shifts – major changes in pelagic ecosystem structure – occurred at the end of the 1980s and during the early 1990s, in the Gulf of Finland during the mid 1990s and in 2003.
- Pelagic food web changes were climate driven and further accelerated by fishing pressure and internal processes; in the Gulf of Riga and Gulf of Finland eutrophication, and in the Gulf of Finland, also hypoxia further affected ecosystem structure.
 |  |
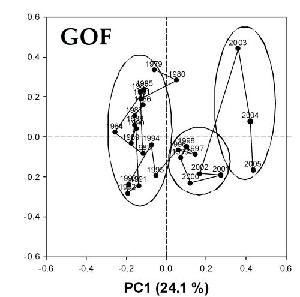 | 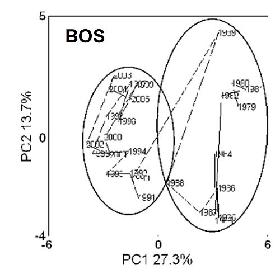 |
Figure 1: Ecosystem regime shifts in the Baltic Proper (top left), Gulf of Riga (top right), Gulf of Finland (bottom left), and Bothnian Sea (bottom right) depicted by principal component scores Click images to enlarge.
Relevance of the indicator for describing developments in the environment
The indicator is based on multivariate analysis of indicator time series. It describes major shifts in ecosystem structure and associates them with fundamental driving factors. Major drivers identified were climate induced changes in temperature and salinity, fishing pressure, as well as variations in bottom water oxygen conditions, which are both climate and eutrophication related. The analysis also shows key interactions between ecosystem components (e.g. resource competition and limitation).
Policy relevance and policy references
The Baltic Sea is subject to pronounced climate driven variations in temperature and salinity levels, which have a distinct impact upon ecosystem structure. Changes in temperature and salinity directly affect the composition of zooplankton and fish communities. Indirect effects are caused by the impact of the saline inflow regime on deep water oxygen conditions, which further influence not only fish recruitment, but also nutrient levels in the Baltic Proper.
Management has – if at all - only little impact on climate driven processes in the Baltic ecosystem. Target levels for Baltic ecosystem components should therefore account for the effect of large scale climatic variations. Also strong interactions between ecosystem components, for example the interrelation between cod, herring and sprat stocks, should be taken into consideration within an adaptive, ecosystem based management framework for the Baltic Sea.
Assessment
Baltic Proper
![]()
Figure 2: “Traffic light” plot for the Baltic Proper; time-series transformed into quintiles and sorted according to PC1; factor loading for PC1 next to variable abbreviation. Click image to enlarge!
The ecosystem of the Baltic Proper changed from a low temperature, high saline state with frequent inflows during the 1970s and 1980s through a freshening and warming stage with extensive bottom water anoxia and high nutrient concentrations in the beginning of the 1990s to a warm, low saline state with stable nutrient concentrations (Fig. 2). Associated were drastic changes in fish and zooplankton communities, driving the Baltic from a cod/herring to a sprat dominated system. Biomass of stenohaline species in the zooplankton community (Pseudocalanus acuspes) decreased, while the share of smaller, temperature controlled taxa (Acartia, Temora) grew.
The changes in the fish community were the combined results of direct and indirect effects of climate on recruitment, as well as of low cod predation pressure. Decreasing salinities and accompanying low oxygen conditions caused recruitment failure of Eastern Baltic cod, largely explaining the collapse of the stock, which was further amplified by high fishing pressure (Köster et al. 2005). Processes leading to recruitment failure were high egg mortality due to low oxygen contents (Köster et al. 2003) and low Pseudocalanus acuspes availability, the preferred larval food (Hinrichsen et al. 2002). In contrast, sprat profited from increased temperatures, which positively affected egg survival (Köster et al. 2003, Baumann et al. 2006) and led to an increase in Acartia spp. biomass, the major food source of sprat larvae (Voss et al. 2003).
Over the time scale investigated, fluctuations in nutrient concentrations were largely driven by the duration of stagnation periods, during which NH4 and PO4 accumulate in the bottom water. Winter DIN and DIP pools in the surface layer loosely followed the bottom water dynamics.
Linkages between phytoplankton and the large scale changes in the Baltic Proper ecosystem were only weakly expressed. Spring dinoflagellate biomass increased with temperature, which Wasmund et al. (1988) explain by reduced deep water mixing during warm winters. The apparent lack of regime shifts in the phytoplankton community was potentially also caused by the shortness of the available time-series.
Gulf of Riga
![]()
Figure 3: “Traffic light” plot for the Gulf of Riga; time-series transformed into quintiles and sorted according to PC1; factor loading for PC1 and PC2 next to variable abbreviation.
The Gulf of Riga (Fig. 3) underwent similar changes in temperature as the Baltic Proper, but due to the absence of high saline bottom water, the effect on salinity conditions was smaller. Also nutrient loads followed a climate driven signal. Similar to the Baltic Proper, zooplankton development in spring benefited from higher temperatures. In the Gulf of Riga this led to increased herring recruitment and growth of the herring stock, which in turn caused a cascading decrease of summer zooplankton biomass (see also Kornilovs et al. 2004). In contrast to the Baltic Proper, summer phytoplankton concentrations and winter nutrient (DIP) pools were tightly related. The increase in winter DIP, decoupled from the load signal, is probably an effect of the long residence time of DIP (Savchuk 2002) in the Gulf of Riga. Internal loading from the bottom sediments, which have accumulated the surplus of past riverine inputs, therefore dominated the DIP dynamics in the Gulf.
Gulf of Finland

![]()
Figure 4. “Traffic light” plot for the Gulf of Finland; time-series transformed into quintiles and sorted according to PC1; factor loading for PC1 next to variable abbreviation.
In the Gulf of Finland, regime shifts in ecosystem composition occurred slightly later than in the Baltic Proper and Gulf of Riga. Similar to the other subsystems, the Gulf of Finland has changed from a saline, relatively cold ecosystem to a warmer, less saline system (Fig. 4). Marine species, e.g. marine zooplankton such as Pseudocalanus acuspes, declined and where replaced by Eurytemora sp. and cladocerans. Fish communities show a similar decline in herring stocks and increase in sprat abundance than in the Baltic Proper. In addition, oxygen deficiency in the bottom waters as well as eutrophication, which lead to an increase in nutrient concentration and phytoplankton biomass, play an important role in determining the ecosystem structure of the Gulf of Finland. After the 2003 salt water inflow, pronounced bottom-water anoxia impacted zooplankton and fish communities so strongly, that the years 2003 – 2005 form a distinct ecosystem regime in the Gulf of Finland.
Bothnian Sea

![]()
Figure 5. “Traffic light” plot for the Bothnian Sea; time-series transformed into quintiles and sorted according to PC1; factor loading for PC1 next to variable abbreviation
Also in the Bothnian Sea a climate-driven regime shift has changed the ecosystem from saline and cold conditions with abundant marine zooplankton (Pseudocalanus and Temora), with large herrings exploited by trapnets, to a warmer and less saline system dominated by brackish water zooplankton such as Bosmina, with abundant, but small herring exploited by trawling (Fig. 5). Salinity decrease was the primary driver of the regime shift in the Bothnian Sea, followed by temperature increase, whereas in contrast to the Gulf of Riga and Gulf of Finland, eutrophication did not affect the ecosystem structure significantly.
Data
Metadata
This indicator fact sheets summarizes the outcome of the ICES/HELCOM/BSRP Workshop on Developing a Framework for an Integrated Assessment for the Baltic Sea [WKIAB]”, held in Tvärminne (Finland), March 1 – 4, 2006 and the first session of the ICES/HELCOM Working Group on Integrated Assessments of the Baltic Sea (WGIAB), held in Hamburg (Germany), March 12 – 16, 2007. During both meetings, time series characterizing key components of the climatic, hydrographic, nutrient, and trophic system of the Baltic Sea were analyzed by principal component analysis to identify distinct temporal ecosystem states, their main properties and underlying driving factors. Detailed information on the workshop outcome and the working group results can be found in ICES (2006a) and ICES (2007).
Technical information
Data source
The data sources for the analysis are listed in table 1 – 4. Abbreviations used: ICES – International Council for the Exploration of the Sea, LATFRA – Latvian Fish Resources Agency, IOW – Institute of Baltic Sea Research, Warnemünde, BED – Baltic Environment Database, Stockholm University, SMHI – Swedish Meteorological and Hydrological Institute, FIMR – Finnish Institute of Marine Research, IFM – Leibniz Institute for Marine Science Kiel, LHEI – Latvian Institute of Aquatic Ecology, HELCOM – Baltic Marine Environment Protection Commission, FGFRI – Finnish Game and Fisheries Research Institute, EMI – Estonian Marine Institute, SBF – Swedish Board of Fisheries
Table 1. Time-series used in the analysis of the Baltic Proper
| VARIABLE | ABBREVIATION | UNIT | AREA | SEASON | SOURCE |
| Cod Spawner biomass | CODSSB | Tonnes | SD 25–32 | Annual | ICES |
| Cod recruitment | CODR2 | No age 2 (10³) | SD 25–32 | Annual | ICES |
| Cod weight | CODWC3 | kg (age 3) | SD 25–32 | Annual | ICES |
| Cod fishing mortality | COD_F47 | age 4–7 | SD 22–32 | Annual | ICES |
| Sprat Spawner biomass | SPRSSB | Tonnes | SD 22–32 | Annual | ICES |
| Sprat recruitment | SPRR1 | No age 1 (10³) | SD 22–32 | Annual | ICES |
| Sprat weight | SPRWC3 | kg (age 3) | SD 22–32 | Annual | ICES |
| Sprat fishing mortality | SPR_F35 | age 3–5 | SD 22–32 | Annual | ICES |
| Herring Spawner biomass | HERSSB | Tonnes | SD 25–29 +32excl. GOR | Annual | ICES |
| Herring recruitment | HERR1 | No age 1 (10³) | SD 25–29 +32excl. GOR | Annual | ICES |
| Herring weight | HERWC3 | kg (age 3) | SD 25–29 +32excl. GOR | Annual | ICES |
| Herring fishing mortality | HER_F26 | age 2–6 | SD 25–29 +32excl. GOR | Annual | ICES |
| Acartia spp.s | Acartia_Spr | mg m-3 | Gotland Basin | Spring | LATFRA |
| Acartia spp. | Acartia_Sum | mg m-3 | Gotland Basin | Summer | LATFRA |
| Temora longicornis | Temora_Spr | mg m-3 | Gotland Basin | Spring | LATFRA |
| Temora longicornis | Temora_Sum | mg m-3 | Gotland Basin | Summer | LATFRA |
| Pseudocalanus acuspes | Pseudo_Spr | mg m-3 | Gotland Basin | Spring | LATFRA |
| Pseudocalanus acuspes | Pseudo_Sum | mg m-3 | Gotland Basin | Summer | LATFRA |
| Chlorophyll a | Chla_BBSpr | mg m-3 | Bornholm Basin | Spring | ICES |
| Chlorophyll a | Chla_BBSum | mg m-3 | Bornholm Basin | Summer | ICES |
| Chlorophyll a | Chla_GBSpr | mg m-3 | Gotland Basin | Spring | ICES |
| Chlorophyll a | Chla_GBSum | mg m-3 | Gotland Basin | Summer | ICES |
| Diatoms | dia_BB_spr | mg m-3 | Bornholm Basin | Spring | Wasmund and Uhlig 2003, IOW |
| Dinoflagellates | dino_BB_spr | mg m-3 | Bornholm Basin | Spring | Wasmund and Uhlig 2003 |
| Bluegreen algae | cyano_BB_spr | mg m-3 | Bornholm Basin | Spring | Wasmund and Uhlig 2003 |
| Diatoms | dia_BB_Sum | mg m-3 | Bornholm Basin | Summer | Wasmund and Uhlig 2003 |
| Dinoflagellates | dino_BB_sum | mg m-3 | Bornholm Basin | Summer | Wasmund and Uhlig 2003 |
| Bluegreen algae | cyano_BB_sum | mg m-3 | Bornholm Basin | Summer | Wasmund and Uhlig 2003 |
| Diatoms | dia_GB_spr | mg m-3 | Gotland Basin | Spring | Wasmund and Uhlig 2003 |
| Dinoflagellates | dino_GB_spr | mg m-3 | Gotland Basin | Spring | Wasmund and Uhlig 2003 |
| Bluegreen algae | cyano_GB_spr | mg m-3 | Gotland Basin | Spring | Wasmund and Uhlig 2003 |
| Diatoms | dia_GB_sum | mg m-3 | Gotland Basin | Summer | Wasmund and Uhlig 2003 |
| Dinoflagellates | dino_GB_sum | mg m-3 | Gotland Basin | Summer | Wasmund and Uhlig 2003 |
| Bluegreen algae | cyano_GB_sum | mg m-3 | Gotland Basin | Summer | Wasmund and Uhlig 2003 |
| Total phytoplankton | Totphyto_BB_spr | mg m-3 | Bornholm Basin | Spring | Wasmund and Uhlig 2003 |
| Total phytoplankton | Totphyto_BB_sum | mg m-3 | Bornholm Basin | Summer | Wasmund and Uhlig 2003 |
| Total phytoplankton | Totphyto_GB_spr | mg m-3 | Gotland Basin | Spring | Wasmund and Uhlig 2003 |
| Total phytoplankton | Totphyto_GB_sum | mg m-3 | Gotland Basin | Summer | Wasmund and Uhlig 2003 |
| Dissolved inorganic nitrogen (surface) | DIN_BB_10_win | mmol m-3 | Bornholm Basin | Winter | BED/IOW/SMHI/FIMR/ICES |
| Dissolved inorganic phosphorus (surface) | DIP_BB_10_win | mmol m-3 | Bornholm Basin | Winter | BED/IOW/SMHI/FIMR/ICES |
| Dissolved inorganic nitrogen (surface) | DIN_GB_10_win | mmol m-3 | Gotland Basin | Winter | BED/IOW/SMHI/FIMR/ICES |
| Dissolved inorganic phosphorus (surface) | DIP_GB_10_win | mmol m-3 | Gotland Basin | Winter | BED/IOW/SMHI/FIMR/ICES |
| Dissolved inorganic nitrogen (deepwater) | DIN_BB_90_sum | mmol m-3 | Bornholm Basin | Summer | BED/IOW/SMHI/FIMR/ICES |
| Dissolved inorganic phosphorus (deepwater) | DIP_BB_90_sum | mmol m-3 | Bornholm Basin | Summer | BED/IOW/SMHI/FIMR/ICES |
| Dissolved inorganic nitrogen (deepwater) | DIN_GB_220_sum | mmol m-3 | Gotland Basin n | Summer | BED/IOW/SMHI/FIMR/ICES |
| Dissolved inorganic phosphorus (deepwater) | DIP_GB_220_sum | mmol m-3 | Gotland Basin | Summer | BED/IOW/SMHI/FIMR/ICES |
| Maximum ice cover | MaxIce | km2 | Baltic | Annual | FIMR |
| Baltic Sea Index | BSI | Central Baltic | Winter | IFM | |
| Inflow strength | inflow | km3 | Central Baltic | Annual | IOW |
| Depth of 11 psu isoline | 11psu_GBAnn | m | Gotland Basin | Annual | LATFRA |
| Cod reproductive volume | REPVOL | km3 | Central Baltic | Annual | IFM |
| Sea surface temperature | SST_BB_Spr | °C | Bornholm Basin | Spring | BED/IOW/SMHI/FIMR/ICES |
| Sea surface temperature | SST_BB_Sum | °C | Bornholm Basin | Summer | BED/IOW/SMHI/FIMR/ICES |
| Sea surface temperature | SST_GB_Spr | °C | Gotland Basin | Spring | BED/IOW/SMHI/FIMR/ICES |
| Sea surface temperature | SST_GB_Sum | °C | Gotland Basin | Summer | BED/IOW/SMHI/FIMR/ICES |
| Midwater temperature (40–60m) | T_BB_60_spr | °C | Bornholm Basin | Spring | BED/IOW/SMHI/FIMR/ICES |
| Midwater temperature (40–60m) | T_BB_60_sum | °C | Bornholm Basin | Summer | BED/IOW/SMHI/FIMR/ICES |
| Midwater temperature (40–60m) | T_GB_60_spr | °C | Gotland Basin | Spring | BED/IOW/SMHI/FIMR/ICES |
| Midwater temperature (40–60m) | T_GB_60_sum | °C | Gotland Basin | Summer | BED/IOW/SMHI/FIMR/ICES |
| Sea surface salinity | SSS_BB | psu | Bornholm Basin | Spring | BED/IOW/SMHI/FIMR/ICES |
| Sea surface salinity | SSS_GB | psu | Gotland Basin | Spring | BED/IOW/SMHI/FIMR/ICES |
| Halocline salinity (70–90m) | S90_BB | psu | Bornholm Basin | Spring | BED/IOW/SMHI/FIMR/ICES |
| Halocline salinity (80–100m) | S100_GB | psu | Gotland Basin | Spring | BED/IOW/SMHI/FIMR/ICES |
| Deepwater oxygen | O2_BB | ml l-1 | Bornholm Basin | Spring | BED/IOW/SMHI/FIMR/ICES |
| Deepwater oxygen | O2_GB | ml l-1 | Gotland Basin | Spring | BED/IOW/SMHI/FIMR/ICES |
Table 2. Time-series used in the analysis of the Gulf of Riga.
| Variable | Abbreviation | Unit | Season | Source |
| Acartia spp. | AC_spr | mg m-3 | Spring | LatFRA |
| Acartia spp. | AC_sum | mg m-3 | Summer | LatFRA |
| Bosmina coregoni maritima | Bos_spr | mg m-3 | Spring | LatFRA |
| Bosmina coregoni maritima | Bos_spr | mg m-3 | Spring | LatFRA |
| Cercopagis pengoi | Cerc | mg m-3 | Summer | LatFRA |
| Eurytemora affinis | Eury_spr | mg m-3 | Spring | LatFRA |
| Eurytemora affinis | Eury_sum | mg m-3 | Summer | LatFRA |
| Evadne nordmanni | Eva_spr | mg m-3 | Spring | LatFRA |
| Limnocalanus grimaldii | Limn_spr | mg m-3 | Spring | LatFRA |
| Limnocalanus grimaldii | Limn_sum | mg m-3 | Summer | LatFRA |
| Podon sp. | Pod_spr | mg m-3 | Spring | LatFRA |
| Synchaeta sp. | Syn_spr | mg m-3 | Spring | LatFRA |
| Chlorophyll a | Chla_spr | mg m-3 | Spring | LHEI |
| Chlorophyll a | Chla_sum | mg m-3 | Summer | LHEI |
| Secchi depth | Sec_spr | m | Spring | LHEI |
| Secchi depth | Sec_sum | m | Summer | LHEI |
| Herring yield | Her_yield | tonnes | Annual | ICES |
| Herring spawner biomass | Her_SSB | tonnes | Annual | ICES |
| Herring weight | Her_W | kg | Annual | ICES |
| Herring recruitment | Her_R | No age 1 | Annual | ICES |
| Cod landings | Cod_catch | tonnes | Annual | ICES |
| Nitrogen | NO23_spr | mmol m-3 | Spring | LHEI |
| Phosphorus | PO4_spr | mmol m-3 | Spring | LHEI |
| Nitrogen load | NO3_load | mmol m-3 | Spring | LHEI |
| Phosphorus load | PO4_load | mmol m-3 | Spring | LHEI |
| Runoff | RunoffJanAug | m3 s-1 | January–August | Laznik et al., 1999, HELCOM |
| Salinity (0–50m) | S_aug50 | psu | August | LATFRA |
| Temperature (0–20m) | T_aug20 | °C | August | LATFRA |
| Temperature (0–50m) | T_aug50 | °C | August | LATFRA |
| Temperature (0–50m) | T_feb50 | °C | Febuary | LATFRA |
| Temperature (0–20m) | T_may20 | °C | May | LATFRA |
| Temperature (0–50m) | T_may50 | °C | May | LATFRA |
| Baltic Sea Index | BSI | – | Winter | IFM |
Table 3: Time-series used in the analysis of the Gulf of Finland
| Variable | Abbreviation | Unit | Season | Source |
| Pseudocalanus acuspes | Pseudo_sum | mg m-3 | Summer | FIMR |
| Temora longicornis | Temora_sum | mg m-3 | Summer | FIMR |
| Acartia spp. | Acartia_sum | mg m-3 | Summer | FIMR |
| Eurytemora affinis | Eury_sum | mg m-3 | Summer | FIMR |
| Limnocalanus lacustris | Limno_sum | mg m-3 | Summer | FIMR |
| Bosmina coregoni maritima | Bosm_sum | mg m-3 | Summer | FIMR |
| Phytoplankton biomass | Phyto_pl | mg m-3 | Summer | FIMR |
| Temperature (0–10m) | Temp_surf_sum | °C | Summer | FIMR |
| Salinity (0–10m) | Salin_surf_sum | psu | Summer | FIMR |
| Salinity (30m–bottom) | Salin_sum_bot | psu | Summer | FIMR |
| Chlorophyll a (0–20m) | Chla_sum | mg m-3 | Summer | FIMR |
| Phosphates | PO4_sum | mmol m-3 | Summer | FIMR |
| Nitrates | NO3_sum | mmol m-3 | Summer | FIMR |
| Phosphates | PO4_win | mmol m-3 | Winter | FIMR |
| Nitrates | NO3_win | mmol m-3 | Winter | FIMR |
| Oxygen bottom | Oxy_bot_sum | ml l-1 | Summer | FIMR |
| Herring landing | HERRland | kg | Annual | FGFRI |
| Sprat landing | SPRATland | kg | Annual | FGFRI |
| Salmon landing | SALMONland | kg | Annual | FGFRI |
| Trout landing | TROUTland | kg | Annual | FGFRI |
| Acartia spp. | Acar_spring | mg m-3 | Spring | EMI |
| Eurytemora affinis | Eury_spring | mg m-3 | Spring | EMI |
| Podon spp. | Podo_spring | mg m-3 | Spring | EMI |
| Limnocalanus lacustris | Limn_spring | mg m-3 | Spring | EMI |
| Pseudocalanus acuspes | Pseu_spring | mg m-3 | Spring | EMI |
| Sprat catch (Estonia) | SprCEst | 1000 tonnes | Annual | EMI |
| Sprat weight at age 3 | SprWA3 | g | Annual | EMI |
| Herring catch (Est+Fin+Rus) | HerCatch | 1000 tonnes | Annual | EMI |
| Herring weight at age 3 | HerWA3 | g | Annual | EMI |
| Temperature (0–10m) | F2TEMPUp | °C | Winter | EMI |
| Silica (0–10m) | F2SLCAUp | mmol m-3 | Winter | EMI |
| Temperature (0–10m) | F5TEMPUp | °C | May | EMI |
| Temperature (0–10m) | F8TEMPUp | °C | August | EMI |
| Salinity (0–10m) | F8SALUp | psu | August | EMI |
| Chlorophyll a (0–10m) | F8CHLA | mg m-3 | August | EMI |
Table 4: Time-series used in the analysis of the Bothnian Sea
| VARIABLE | ABBREVIATION | UNIT | SEASON | AREA | SOURCE |
| Perch catch per unit effort | perchCPUE | numbers net-1 night-1 | Summer | SW Bothnian Sea coast | SBF |
| Roach catch per unit effort | roachCPUE | numbers net-1 night-1 | Summer | SW Bothnian Sea coast | SBF |
| Herring total stock biomass | herrTSB | tonnes | Annual | Bothnian Sea offshore | ICES |
| Herring recruitment | herrRecr | thousands of 1-yr-olds | Annual | Bothnian Sea offshore | ICES |
| Herring weight at age 5 | herrsize5 | kg | Annual | Bothnian Sea offshore | ICES |
| Macoma balthica biomass | MacomaS | g m-2 | Summer | SW Bothnian Sea coast | SBF |
| Diatoms | Diatoms | mg m-3 | Summer | Bothnian Sea offshore | FIMR |
| Dinoflagellates | Dinoflag | mg m-3 | Summer | Bothnian Sea offshore | FIMR |
| Cyanobacteria | Cyanobact | mg m-3 | Summer | Bothnian Sea offshore | FIMR |
| Phytoplankton | Phytopl | mg m-3 | Summer | Bothnian Sea offshore | FIMR |
| Acartia sp. | Acartia | mg m-3 | Summer | Bothnian Sea offshore | FIMR |
| Bosmina sp. | Bosmina | mg m-3 | Summer | Bothnian Sea offshore | FIMR |
| Eurytemora sp. | Eurytem | mg m-3 | Summer | Bothnian Sea offshore | FIMR |
| Limnocalanus sp. | Limnocal | mg m-3 | Summer | Bothnian Sea offshore | FIMR |
| Evadne sp.and Podon sp. | EvadnPodon | mg m-3 | Summer | Bothnian Sea offshore | FIMR |
| Pseudocalanus sp. | Pseudocal | mg m-3 | Summer | Bothnian Sea offshore | FIMR |
| Temora sp. | Temora | mg m-3 | Summer | Bothnian Sea offshore | FIMR |
| Macoma baltica | MacomaN | g sample-1 | Summer | NW Bothnian Sea coast | Umeå University |
| Chlorophyll a | Chla | mg m-3 | Summer | Bothnian Sea offshore | FIMR |
| Surface temperature (0–10 m) | tempwsurf | degrees C | Winter | Bothnian Sea offshore | SMHI, FIMR |
| Surface temperature (0–10 m) | tempssurf | degrees C | Summer | Bothnian Sea offshore | SMHI, FIMR |
| Bottom temperature (30-m) | tempsbot | degrees C | Summer | Bothnian Sea offshore | SMHI, FIMR |
| Salinity bottom (30-m) | salwbot | psu | Winter | Bothnian Sea offshore | SMHI, FIMR |
| Dissolved inorganic phosphorous (0–10 m) | POwsurf | mmol m-3 | Winter | Bothnian Sea offshore | SMHI, FIMR |
| Dissolved inorganic nitrogen (0–10 m) | NOwsurf | mmol m-3 | Winter | Bothnian Sea offshore | SMHI, FIMR |
| Maximum ice coverage | maxice | km2 | Winter | Baltic Sea | FGFIR |
| Runoff dissolved inorganic nitrogen | DINrunoff | tonnes | Annual | W Bothnian Sea coast | Swedish University of Agricultural Sciences, Environmental Assessment Unit |
| Runoff dissolved inorganic phosphorous | POrunoff | tonnes | Annual | W Bothnian Sea coast | Swedish University of Agricultural Sciences, Environmental Assessment Unit |
| Runoff silicate | Sirunoff | tonnes | Annual | W Bothnian Sea coast | Swedish University of Agricultural Sciences, Environmental Assessment Unit |
| Commercial trawl effort | trawlh | h | Annual | Bothnian Sea | FGFRI |
| Commercial trapnets | trapnets | number of nets | Annual | E Bothnian Sea coast | FGFRI |
Description of data
Nutrient, hydrographic and phytoplankton data were taken from various national marine monitoring programs within HELCOM COMBINE, collected both in the ICES marine monitoring database, as well as by the Baltic Environment Database at Stockholm University and the SHARK database at SMHI. Zooplankton data for the Baltic Proper and Gulf of Riga were contributed from the Latvian Fish Resources Agency monitoring programme. Stocks, landing and recruitment of commercial fish species were used as published by the ICES fish stock assessments (ICES 2006b). Tables 1 - 4 contain a detailed description of the data sources of the indicator time series for the Baltic Proper, Gulf of Riga, Gulf of Finland and Bothnian Sea, respectively.
Temporal coverage
In the Baltic Proper and Gulf of Riga, the analysis covers the time period 1974 - 2005. Most indicator time series used cover the entire time period, but phytoplankton and chlorophyll a data for the Baltic Proper were available only from 1979. In the Gulf of Finland and Bothnian Sea the analysis and the indicator time-series used span 1979 – 2005.
Methodology and frequency of data collection
Nutrient, hydrographic and phytoplankton time series were mostly collected according to the methods of the HELCOM COMBINE manual. Zooplankton data were derived from seasonal surveys by the Latvian Fisheries Resource Agency using a Juday net (Möllmann et al. 2000).
Methodology of data manipulation
Datasets were analyzed by Principal Component Analysis (PCA). Missing values in the dataset were replaced by the mean values of the respective variable. To improve linearity between variables and reduce the relationship between the mean and the variance some of the variables were ln(x+1) transformed. Subsequently a standardized PCA based on the correlation matrix was performed on the transformed values. The occurrence of regime shifts - rapid changes in the datasets from one state to another - was subsequently examined by chronological clustering, using intermediate linkage clustering (Legendre et al. 1985, Legendre and Legendre 1998).
The ecosystem changes were further presented in “traffic-light plots” (Choi et al. 2005). The plots present the raw values of each variable, categorized into quintiles, which are assigned a specific colour. To detect systematic patterns in the time series, the variables are sorted according to their loadings along the first principal component.
Finally, to test the significance of potential ecosystem drivers, the dataset for each ecosystem were divided into explanatory (mainly hydrographical parameters, nutrient loads, fishing pressure) and response variables (biological parameters). Redundancy Analysis was used to test which combination of explanatory variables explained the response variables best.
Quality of information
Strength and weakness (at data level)
The indicator summarizes changes in time series characterizing a wide spectrum of ecosystem components and potential driving factors, ranging from climate and hydrography to nutrients, lower and upper trophic level species biomass. The analysis also includes direct anthropogenic forcing as for example nutrient loads and fishing pressure.
2. Reliability, accuracy, robustness, uncertainty (at data level)
The reliability of the regime shifts detected depends on the ability of the indicator time series used to depict key processes in the Baltic ecosystem. Further, the robustness of the analysis depends on the length of the time series in comparison to the time scale of processes, by which they are influenced, i.e. systematic patterns can only be detected if they occur within the ~ 30 year timeframe covered by the analysis. Further, the data analysis highlights consistent patterns in indicator time series, involving a large number of indicators but reveals processes impacting on single or few ecosystem components only in higher order principal components.
3. Further work required (for data level and indicator level)
Further work is required to refine the indicators used in the analysis. The raw data provided by the Baltic marine monitoring programs should be routinely aggregated into indicator time series that characterize key processes in the Baltic ecosystem, involving scientific expert groups. Future analysis should further expand the spatial coverage of the analysis and should investigate the stability of the ecosystem regimes identified, as well as the reversibility of ecosystem regime transitions.
References
Baumann, H., Hinrichsen, H.-H., Malzahn, A., Möllmann, C., Köster, F.W. and Temming, A. 2006. Sprat recruitment in the Baltic Sea: the importance of temperature and transport variability during the late larval and early juvenile stages. Can. J. Fish. Aquat. Sci. in press.
Choi, J. S., Frank, K. T., Petrie, B. D. and Leggett, W. C. 2005. Integrated ecosystem assessment of a large marine ecosystem: a case study of the devolution of the Eastern Scotian Shelf, Canada. Oceanography and Marine Biology: an Annual Review, 43: 47–67.
Hinrichsen, H.H., Möllmann, C., Voss, R., Köster, F.W. and Kornilovs, G. 2002. Bio-physical modelling of larval Baltic cod (Gadus morhua) survival and growth. Can. J. Fish. Aquat. Sci., 59: 1958-1873.
ICES. 2007. Report of the ICES/HELCOM Working Group on Integrated Assessments of the Baltic Sea (WGIAB), 12 – 16 March 2007, Hamburg, Germany. ICES CM 2007/BCC:04. 71 pp.
ICES. 2006a. Report of the ICES/BSRP/HELCOM Workshop on Developing a Framework for Integrated Assessment for the Baltic Sea (WKIAB), 1-4 March 2006, Tvärminne, Finland. ICES CM 2006/BCC:09. 57 pp.
ICES. 2006b. Report of the Baltic Fisheries Assessment Working Group (WGBFAS). ICES CM 2006/ACFM:24.
Köster, F.W., Möllmann, C., Neuenfeldt, S., Vinther, M., St. John, M.A., Tomkiewicz, J., Voss, R., Hinrichsen, H.H., Kraus, G. and Schnack, D. 2003. Fish stock development in the Central Baltic Sea (1976-2000) in relation to variability in the physical environment. ICES Mar. Sci. Symp., 219: 294-306.
Köster, F.W., Möllmann, C., Hinrichsen, H.-H., Tomkiewicz, J., Wieland, K., Kraus, G., Voss, R., MacKenzie, B.R., Schnack, D., Makarchouk, A., Plikshs, M. and Beyer J.E. 2005. Baltic cod recruitment – the impact of climate and species interaction. ICES J. Mar. Sci., 62: 1408-1425.
Laznik, M., Stalnacke, P., Grimvall, A., Wittgren, H.B. 1999. Riverine input of nutrients to the Gulf of Riga – temporal and spatial variation. Journal of Marine Systems 23:11-25.
Legendre, P, and Legendre, L. .1998.. Numerical Ecology, 2nd English Edition. Elsevier Science B.V., Amsterdam, 1998, XV + 853pp.
Legendre, P., Dallot, S., and Legendre, L. 1985. Succession of species within a community: Chronological clustering, with applications to marine and freshwater zooplankton. Am. Nat., 125: 257-288.
Möllmann, C., Kornilovs, G. and Sidrevics, L. 2000. Long-term dynamics of main mesozooplankton species in the Central Baltic Sea. J. Plankton Res., 22: 2015–2038.
Voss, R., Köster, F.W. and Dickmann, M. 2003. Comparing the feeding habits of co-occurring sprat (Sprattus sprattus) and cod (Gadus morhua) larvae in the Bornholm Basin, Baltic Sea. Fish. Res., 63: 97-111.
Wasmund, N. and Uhlig, S. 2003. Phytoplankton trends in the Baltic Sea. ICES J. Mar. Sci., 60 : 177-186.
Wasmund, N., Nausch, G., and Matthäus, W. 1998. Phytoplankton spring blooms in the southern Baltic Sea - spatio-temporal development and long-term trends. J. Plankt. Res., 20: 1099-1117.
Notes:
1 Hamburg University
2 Latvian Institute of Aquatic Ecology
3 Finnish Institute of Marine Research
4 Institute of Coastal Research, Swedish Board of Fisheries
For reference purposes, please cite this indicator fact sheet as follows:
[Author’s name(s)], [Year]. [Indicator Fact Sheet title]. HELCOM Indicator Fact Sheets 2007. Online. [Date Viewed], http://www.helcom.fi/environment2/ifs/en_GB/cover/.
Last updated: 5.10.2006
