Atmospheric depositions of heavy metals on the Baltic Sea
|
||||
Key message
![]() Total annual atmospheric depositions of heavy metals to the Baltic Sea have decreased in period from 1990 to 2005 by 43% for cadmium, 33% for mercury, and 65% for lead.
Total annual atmospheric depositions of heavy metals to the Baltic Sea have decreased in period from 1990 to 2005 by 43% for cadmium, 33% for mercury, and 65% for lead.
Results and Assessment
Relevance of the indicator for describing the developments in the environment
This indicator shows the levels and trends in cadmium, mercury, and lead atmospheric depositions to the Baltic Sea. The depositions of heavy metals represent the pressure of emission sources on the Baltic Sea aquatic environment.
Policy relevance and policy reference
HELCOM adopted a Recommendation in May 2001 for the cessation of hazardous substance discharges/emissions by 2020, with the ultimate aim of achieving concentrations in the environment near to background values for naturally occurring substances and close to zero for man-made synthetic substances.
Assessment
Total annual atmospheric depositions of heavy metals to the surface of the Baltic Sea have substantially decreased in period 1990-2005 (Figure 1). The most significant drop in depositions over the Baltic Sea is obtained for lead (65%). The decrease of cadmium and mercury depositions is amounted to 43% and 33%, respectively. On the level of individual sub-basins the most significant drop in cadmium and lead depositions can be noted for the Gulf of Finland (64% and 73%). Largest decrease in mercury depositions is obtained for the Kattegat (51%). In spatial distribution of heavy metals depositions on the Baltic Sea the highest levels can be noted for the southern-western part of the Baltic Sea (the Belt Sea and the Kattegat). Among the HELCOM countries the most significant contributions to depositions over the Baltic Sea belong to Poland, Germany, and Russia.
The reduction of atmospheric input of lead, cadmium, and mercury to the Baltic Sea is a result of abatement measures as well as of economic contraction and industrial restructuring in Poland, Estonia, Latvia, Lithuania, and Russia in early 1990s.
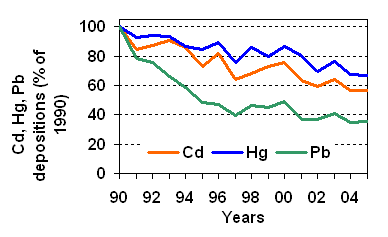
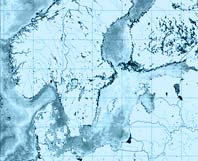
Figure 1: Computed total annual atmospheric depositions of cadmium, mercury, and lead to the Baltic Sea for the period 1990-2005, (% of 1990).
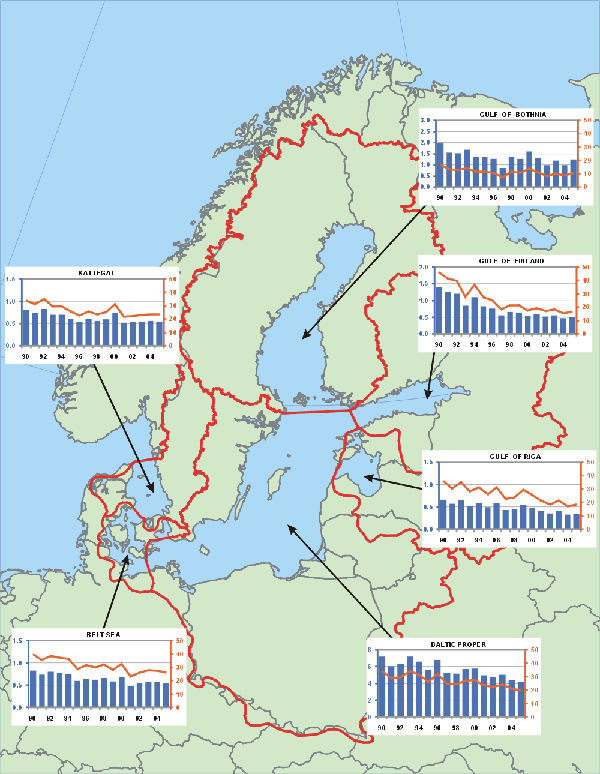
Figure 2: Time-series of computed total annual atmospheric deposition of cadmium to six sub-basins of the Baltic Sea for the period 1990-2005 in tonnes/year as bars (left axis) and total deposition fluxes in g/km2/year as lines (right axis). Note that different scales are used for total depositions in tonnes/year and the same scales for total deposition fluxes. Click image to enlarge!
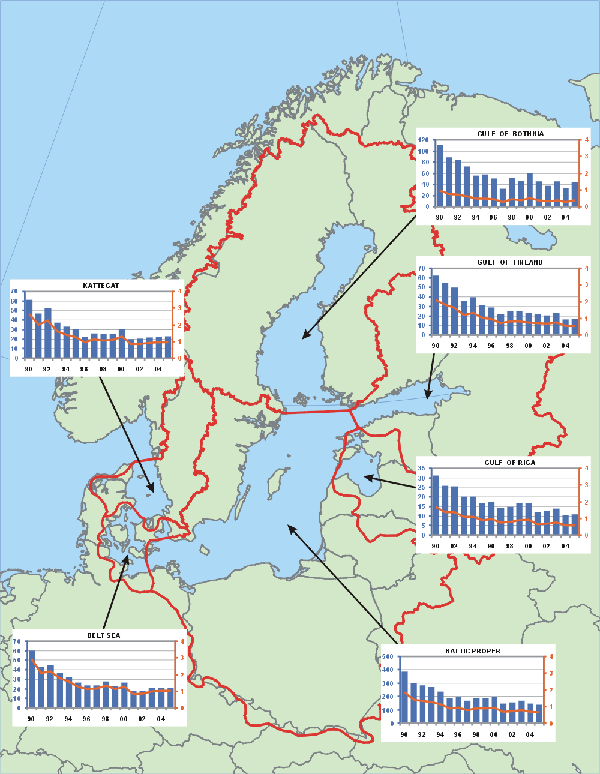
Figure 3: Time-series of computed total annual atmospheric deposition of lead to six sub-basins of the Baltic Sea for the period 1990-2005 in tonnes/year as bars (left axis) and total deposition fluxes in kg/km2/year as lines (right axis). Note that different scales are used for total depositions in tonnes/year and the same scales for total deposition fluxes. Click image to enlarge!
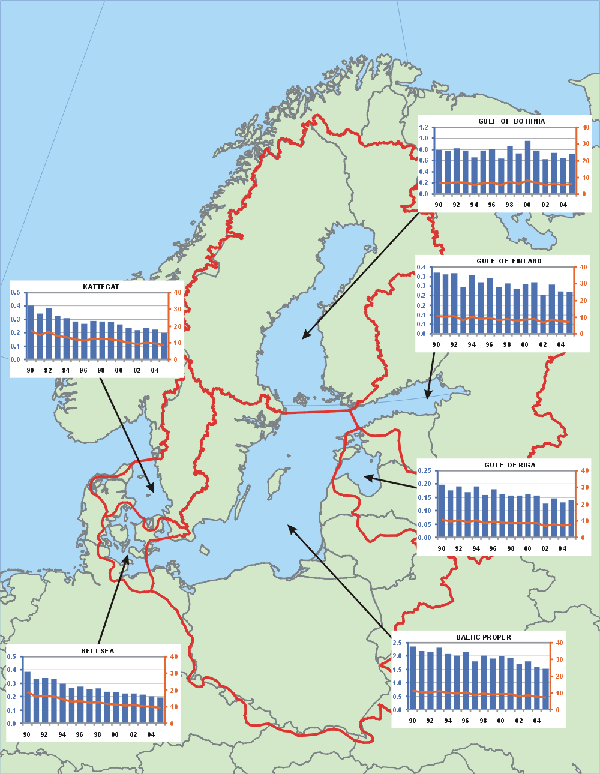
Figure 4: Time-series of computed total annual atmospheric deposition of mercury to six sub-basins of the Baltic Sea for the period 1990-2005 in tonnes/year as bars (left axis) and total deposition fluxes in g/km2/year as lines (right axis). Note that different scales are used for total depositions in tonnes/year and the same scales for total deposition fluxes. Click image to enlarge!
Data
Table 1. Computed total annual depositions of cadmium to six Baltic Sea sub-basins for period 1990-2005. Units: tonnes/year
| 1990 | 1991 | 1992 | 1993 | 1994 | 1995 | 1996 | 1997 | 1998 | 1999 | 2000 | 2001 | 2002 | 2003 | 2004 | 2005 | |
| GUB | 1.97 | 1.54 | 1.51 | 1.67 | 1.35 | 1.34 | 1.25 | 0.84 | 1.37 | 1.27 | 1.58 | 1.29 | 0.97 | 1.18 | 0.98 | 1.24 |
| BAP | 7.20 | 6.04 | 6.26 | 7.19 | 6.56 | 5.53 | 6.74 | 5.22 | 5.11 | 5.70 | 5.75 | 4.93 | 4.69 | 5.02 | 4.39 | 4.11 |
| GUF | 1.39 | 1.24 | 1.20 | 0.83 | 1.10 | 0.83 | 0.76 | 0.55 | 0.65 | 0.64 | 0.53 | 0.58 | 0.51 | 0.55 | 0.46 | 0.50 |
| GUR | 0.66 | 0.56 | 0.65 | 0.52 | 0.57 | 0.48 | 0.57 | 0.42 | 0.44 | 0.54 | 0.47 | 0.39 | 0.34 | 0.39 | 0.31 | 0.34 |
| BES | 0.82 | 0.73 | 0.79 | 0.76 | 0.75 | 0.59 | 0.65 | 0.61 | 0.66 | 0.58 | 0.67 | 0.47 | 0.54 | 0.57 | 0.56 | 0.54 |
| KAT | 0.79 | 0.73 | 0.82 | 0.69 | 0.69 | 0.60 | 0.52 | 0.60 | 0.55 | 0.59 | 0.73 | 0.51 | 0.52 | 0.54 | 0.55 | 0.54 |
| BAS | 12.8 | 10.8 | 11.2 | 11.7 | 11.0 | 9.4 | 10.5 | 8.3 | 8.8 | 9.3 | 9.7 | 8.2 | 7.6 | 8.3 | 7.3 | 7.3 |
Table 2. Computed total annual depositions of lead to six Baltic Sea sub-basins for period 1990-2005. Units: tonnes/year
| 1990 | 1991 | 1992 | 1993 | 1994 | 1995 | 1996 | 1997 | 1998 | 1999 | 2000 | 2001 | 2002 | 2003 | 2004 | 2005 | |
| GUB | 111 | 88 | 83 | 72 | 55 | 57 | 50 | 31 | 51 | 46 | 59 | 46 | 37 | 45 | 33 | 44 |
| BAP | 387 | 300 | 283 | 269 | 236 | 184 | 196 | 167 | 186 | 186 | 196 | 147 | 153 | 167 | 147 | 136 |
| GUF | 62 | 54 | 50 | 36 | 40 | 31 | 29 | 22 | 25 | 25 | 23 | 21 | 20 | 23 | 16 | 17 |
| GUR | 31 | 26 | 25 | 20 | 20 | 17 | 17 | 14 | 15 | 17 | 17 | 12 | 12 | 14 | 10 | 11 |
| BES | 60 | 43 | 45 | 37 | 32 | 26 | 23 | 24 | 27 | 23 | 26 | 17 | 18 | 20 | 21 | 21 |
| KAT | 61 | 47 | 52 | 37 | 33 | 30 | 22 | 26 | 25 | 25 | 31 | 20 | 20 | 21 | 22 | 22 |
| BAS | 713 | 557 | 538 | 470 | 416 | 345 | 337 | 284 | 329 | 321 | 351 | 263 | 260 | 291 | 250 | 251 |
Table 3. Computed total annual depositions of mercury to six Baltic Sea sub-basins for period 1990-2005. Units: tonnes/year
| 1990 | 1991 | 1992 | 1993 | 1994 | 1995 | 1996 | 1997 | 1998 | 1999 | 2000 | 2001 | 2002 | 2003 | 2004 | 2005 | |
| GUB | 0.79 | 0.77 | 0.82 | 0.78 | 0.66 | 0.78 | 0.81 | 0.63 | 0.86 | 0.73 | 0.96 | 0.78 | 0.62 | 0.74 | 0.65 | 0.72 |
| BAP | 2.35 | 2.17 | 2.15 | 2.30 | 2.08 | 2.01 | 2.14 | 1.79 | 2.00 | 1.91 | 1.98 | 1.92 | 1.68 | 1.79 | 1.59 | 1.51 |
| GUF | 0.32 | 0.31 | 0.32 | 0.25 | 0.31 | 0.27 | 0.29 | 0.25 | 0.26 | 0.23 | 0.26 | 0.27 | 0.20 | 0.26 | 0.22 | 0.22 |
| GUR | 0.20 | 0.18 | 0.19 | 0.17 | 0.19 | 0.16 | 0.18 | 0.16 | 0.16 | 0.16 | 0.16 | 0.16 | 0.13 | 0.15 | 0.13 | 0.14 |
| BES | 0.38 | 0.33 | 0.34 | 0.33 | 0.30 | 0.26 | 0.27 | 0.25 | 0.26 | 0.24 | 0.23 | 0.22 | 0.22 | 0.21 | 0.20 | 0.19 |
| KAT | 0.40 | 0.34 | 0.38 | 0.33 | 0.31 | 0.28 | 0.27 | 0.29 | 0.28 | 0.28 | 0.26 | 0.23 | 0.22 | 0.23 | 0.22 | 0.20 |
| BAS | 4.4 | 4.1 | 4.2 | 4.2 | 3.8 | 3.8 | 4.0 | 3.4 | 3.8 | 3.5 | 3.9 | 3.6 | 3.1 | 3.4 | 3.0 | 3.0 |
Metadata
Technical information:
1. Source: EMEP/MSC-E
2. Description of data: The atmospheric depositions of heavy metals were obtained using the latest version of MSCE-HM model developed at EMEP/MSC-E (Travnikov and Ilyin, 2005). The latest available official emission data for the HELCOM countries have been used in the model computations. Emissions of all three metals for each year of this period were officially reported to the UN ECE Secretariat by most of HELCOM countries. These data are available from EMEP emission database WEBDAB: http://webdab.emep.int. Some of the countries, in particular, Russia, did not submit the data for 2001. Missing information was obtained on the basis of official data by interpolation. These data were used for modelling of transboundary air pollution by heavy metals within European region including the Baltic Sea and its catchment area.
3. Geographical coverage: Atmospheric depositions of lead, cadmium, and mercury were obtained for the European region.
4. Temporal coverage: Timeseries of annual atmospheric depositions are available for the period 1990 – 2005.
5. Methodology and frequency of data collection: Atmospheric input and source allocation budgets of heavy metals (cadmium, lead, and mercury) to the Baltic Sea and its catchment area were computed using the latest version of MSCE-HM model. MSCE-HM is the regional-scale model operating within the EMEP region. This is a three-dimensional Eulerian model which includes processes of emission, advection, turbulent diffusion, chemical transformations of mercury, wet and dry depositions, and inflow of pollutant into the model domain. Horizontal grid of the model is defined using stereographic projection with spatial resolution 50 km at 60º latitude. The description of EMEP horizontal grid system can be found in the internet (http://www.emep.int/grid/index.html). Vertical structure of the model consists of 15 non-uniform layers defined in the terrain-following s-coordinates and covers almost the whole troposphere. Detailed description of the model can be found in EMEP reports (Travnikov and Ilyin, 2005) and in the Internet on EMEP web page http://www.emep.int under the link to information on Heavy Metals. Meteorological data used in the calculations for 1990-2004 were obtained using MM5 meteorological data preprocessor on the basis of the Re-analysis project data prepared by National Centers for Environmental Predictions together with National Center of the Atmospheric Research (NCEP/NCAR) in the USA (http://wesley.ncep.noaa.gov/reanalysis.html).
Calculations of atmospheric transport and depositions of lead, cadmium, and mercury are provided on the regular basis annually two years in arrears on the basis of emission data officially submitted by Parties to CLRTAP Convention.
Quality information:
6. Strength and weakness:
Strength: annually updated information on atmospheric input of lead, cadmium, and mercury to the Baltic Sea and its sub-basins.
Weakness: uncertainties in officially submitted data on emissions of heavy metals.
7. Uncertainty: The MSCE-HM model has been verified in a number of intercomparison campaigns with other regional models (Sofiev et al., 1996; Gusev et al., 2000; Ryaboshapko et al., 2001,2005) and has been qualified by means of sensitivity and uncertainty studies (Travnikov, 2000). It was concluded in this publications that the results of heavy metal airborne transport modeling are in satisfactory agreement with the available measurements and discrepancy does not exceed on average a factor of two. The comparison of calculated versus measured data indicates that the model predicts the observed air concentrations of lead and cadmium within the accuracy of 30%. For concentrations in precipitation the difference between calculated and measured values may reach two times. Computed mercury concentrations deviate from measured values within a factor of two.
The MSCE-HM model results were compared with measurements of EMEP monitoring network (Ilyin and Travnikov, 2007). The model was evaluated through the comparison with available measurements and the results of other HM models during EMEP TFMM meetings held in 2005 in Zagreb and in Moscow. It was concluded that the MSCE-HM model is suitable for the evaluation of the long range transboundary transport and deposition of HMs in Europe.
8. Further work required: Further work is required on reducing uncertainties in emission data and modeling approaches used in MSCE-HM model.
References
Gusev A., Ilyin I., Petersen G., van Pul A. and Syrakov D. [2000] Long-range transport model intercomparison studies. Model intercomparison study for cadmium. EMEP/ESC-E Report 2/2000, Meteorological Synthesizing Centre – East, Moscow, Russia. (http://www.msceast.org/reps/2_2000.zip)
Ilyin I., O. Rozovskaya, V. Sokovykh, O. Travnikov (2007) Atmospheric modelling of heavy metal pollution in Europe: Further development and evaluation of the MSCE-HM model. EMEP/MSC-E Technical Report 4/2007. (http://www.msceast.org/reps/4_2007.zip)
Ryaboshapko A., Ilyin I., Bullock R., Ebinghaus R., Lohman K., Munthe J., Petersen G., Segneur C., Wangberg I. [2001] Intercomparison study of numerical models for long-range atmospheric transport of mercury. Stage I: Comparison of chemical modules for mercury transformations in a cloud/fog environment. EMEP/MSC-E Technical report 2/2001, Meteorological Synthesizing Centre – East, Moscow, Russia. (http://www.msceast.org/abstract/201.html)
Ryaboshapko A., Artz R., Bullock R., Christensen J., Cohen M., Draxler R., Ilyin I., Munthe J., Pacyna J., Petersen G., Syrakov D., and Travnikov O. [2005] Itercopmparison study of numerical models for long-range atmospheric transport of mercury. Stage III. Comparison of modelling results with long-term observations and comparison of calculated itens of regional balances. EMEP/MSC-E Technical Report 1/2005, Meteorological Synthesizing Centre – East, Moscow, Russia. (http://www.msceast.org/reps/1_2005.zip)
Sofiev M., Maslyaev A. and Gusev A. [1996] Heavy metal model intercomparison. Methodology and results for Pb in 1990. EMEP/MSC-E Report 2/1996, Meteorological Synthesizing Centre - East, Moscow, Russia. (http://www.msceast.org/reps/2_1996.zip)
Travnikov O. [2000] Uncertainty analysis of heavy metals long-range transport modelling. EMEP/MSC-E Technical note 9/2000, Meteorological Synthesizing Centre - East, Moscow, Russia. (http://www.msceast.org/abstract/900.html)
Travnikov O. and Ilyin I. (2005) Regional Model MSCE-HM of Heavy Metal Transboundary Air Pollution in Europe. EMEP/MSC-E Technical Report 6/2005. (http://www.msceast.org/events/review/hm_description.html)
For reference purposes, please cite this indicator fact sheet as follows:
[Author’s name(s)], [Year]. [Indicator Fact Sheet title]. HELCOM Indicator Fact Sheets 2007. Online. [Date Viewed], http://www.helcom.fi/environment2/ifs/en_GB/cover/.
Last updated 3.9.2007
