ATTACHMENT
6.
Recent study of Mnemiopsis leidyi
in Ukranian waters of the Black Sea.
G. A. Finenko, Z. A.
Romanova, B. E. Anninski, G. I. Abolmasova
Institute of Biology of the Southern Seas of Ukranian National Academy
of Science
This study aimed to estimate predatory
impact of two new alien ctenophores Mnemiopsis leidyi and Beroe ovata on
planktonic community in inshore waters of the Black Sea.
The research tasks were:
study annual dynamics of abundance,
biomass and population structure of M. leidyi (1995–1996) and both M. leidyi
and B. ovata in Sevastopol Bay and adjacent water regions (1999–2000).
measure ingestion and growth rates of
both ctenophore species and the effects of food concentration and body weight on these
parameters in the laboratory experiments
quantify the B. ovata predatory
impact on M. leidyi population.
The population dynamics, abundance and
biomass of the ctenophore M. leidy was studied in Sevastopol Bay during 2 years
(from January 1995 to March 1996 when B. ovata was absent and from September 1999
to March 2001 after B. ovata arrived). Sampling locations are shown in Fig.1.
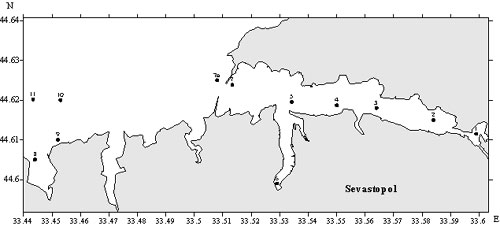
Figure 1. Sampling
locations 1-11 in Sevastopol Bay and adjacent water area
The ctenophores achieved maximum
abundance (3000 ind m–2) in July and maximum biomass (600 g m–2)
in August in 1995 ( Fig.2,a,b ). The young specimens (<10 mm) contributed for that
period as much as 90% to the total abundance of the population. The reproduction continued
until the end of October but the biomass decreased due to elimination of the over-wintered
animals. Maximum wet weight of M. leidyi in population appeared to be before
the reproduction (Fig.2,c). During the year, the energy content of the animals of
different size groups in the population (1–15 mm) varied but there was no correlation
either with the size of the ctenophores or with the season (Fig.2, d).
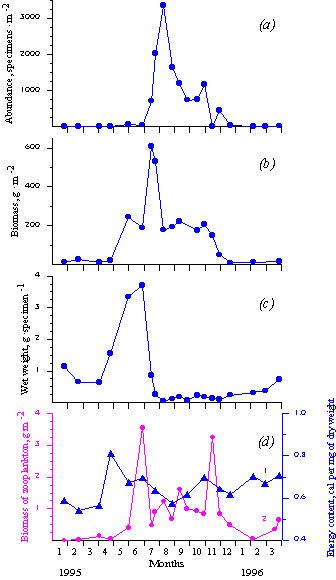
Figure 2. Abundance
(a), biomass (b), and mean wet weight (c) of M.leidyi in the Sevastopol Bay in 1995-1996,
(d) – 1 energy content of M.leidyi, 2 – biomass of fodder zooplankton
The maximum specific growth rate was
observed during the period of active reproduction of adult animals and intensive growth of
young ctenophores (August–September). For the subsequent months this value decreased
(Table 1).
Table 1. Specific
growth rate of M. leidyi population (µ day-1 ) in Sevastopol Bay
Period |
Days |
W0 |
Wt |
m
day-1 |
10.08
-11.09 |
31 |
0.015 |
0.126 |
0.092 |
26.09-
30.10 |
35 |
0.020 |
0.126 |
0.073 |
26.09
- 21.12 |
85 |
0.020 |
0.280 |
0.031 |
30.11
- 28.03 |
120 |
0.007 |
0.460 |
0.035 |
28.03
- 29.06 |
60 |
0.460 |
1.020 |
0.013 |
Note: W0 is
initial wet weight; Wt is final wet weight, g
The growth, food consumption and the
clearance rates were measured in the laboratory under two food concentrations (Acartia
clausi and Moina micrura; 60 and 100 specimens per liter, 0.35 and 0.60 mg dry
weight/l.) Both concentrations were sufficient for the growth of small animals with a dry
weight less than 20 mg; however, these concentrations were insufficient for the growth of
larger ctenophores (Table 2) . At a concentration of 0.35 mg/l, the maximum specific
growth rate as well as maximum gross growth efficiency occurred in the smallest animals
(0.15 mg of dry weight) and decreased with increasing of ctenophore weight. The daily
rations in small ctenophores varied from 28 to 74% of the body energy content. At these
food conditions the specific daily ration of animals > 20 mg was lower (5-15% of the
body energy content), but the energy consumed appeared to be insufficient for growth: the
ctenophores daily lost about 10% of their body weight.
Table 2. Food
consumption and growth of M. leidyi at two food concentrations (Acartia clausi and Moina
micrura) in the experiments
Food concentration (mg of dry weight per 1) |
Duration of experiment (days) |
Wo |
Wt |
Energy content (cal/
specimen) |
Specific growth rate (in terms of weight)
m (day-1) |
Ration |
Growth |
K1 |
F (1/g h) |
mg dry weight |
Cal/cal day-1 |
0.35 |
8.6 |
0.15 |
4.0 |
1.38 |
0.38 |
0.43 |
0.21 |
0.50 |
20.15 |
| |
5.8 |
0.76 |
5.2 |
2.31 |
0.31 |
0.74 |
0.27 |
0.36 |
19.62 |
| |
8.6 |
1.02 |
5.60 |
2.38 |
0.20 |
0.29 |
0.16 |
0.55 |
7.40 |
| |
5.7 |
13.74 |
19.70 |
11.33 |
0.063 |
0.24 |
0.07 |
0.29 |
5.08 |
| |
5.7 |
17.92 |
27.20 |
15.60 |
0.07 |
0.28 |
0.08 |
0.30 |
6.96 |
| |
4.7 |
47.27 |
27.90 |
24.76 |
-0.112 |
0.05 |
-0.11 |
-2.37 |
0.47 |
| |
5.7 |
48.39 |
26.10 |
25.74 |
-0.108 |
0.150 |
-0.084 |
-0.56 |
2.51 |
0.60 |
8.0 |
20.40 |
15.50 |
11.39 |
-0.034 |
0.241 |
-0.034 |
-0.14 |
4.35
|
| |
7.0 |
40.60 |
22.90 |
21.15 |
-0.083 |
0.280 |
-0.082 |
-0.029 |
5.35 |
Specific growth rate of Mnemiopsis
leidyi population (m ) in Sevastopol Bay
Period |
Days |
W0 |
Wt |
m |
10.08 -11.09 |
31 |
0,015 |
0,126 |
0,092 |
26.09- 30.10 |
35 |
0,020 |
0,126 |
0,073 |
26.09 - 21.12 |
85 |
0,020 |
0,280 |
0,031 |
30.11 - 28.03 |
120 |
0,007 |
0,460 |
0,035 |
28.03 - 29.06 |
60 |
0,46 0 |
1,020 |
0,013 |
Note: W0–
initial wet weight; Wt –final wet weight (g)
The correlation was evident between the
specific clearance rate values obtained at both concentrations and the weight of
ctenophores (or the energy content). ( Fig.3).
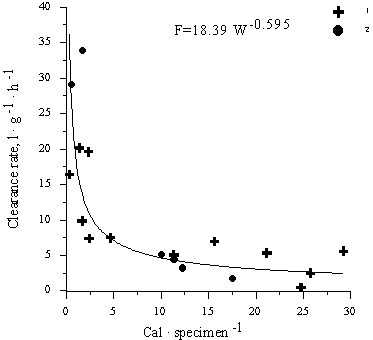
Figure 3.
Relationship between clearance rate and body weight of M.leidyi at different food
concentrations 1 – 0.35; 2 – 0.60 mg of dry weight per l
On the basis of the results of the field
observations and laboratory experiments the predator impact of M. leidyi population
on zooplankton in Sevastopol Bay was estimated (Fig.4).
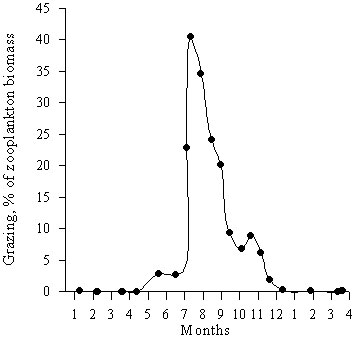
Figure 4. Annual
dynamics of grazing impact of M. leidyi on zooplankton biomass in Sevastopol Bay in
1995–1996
During the year ctenophores grazed daily
from < 1 to 35% of zooplankton biomass. In winter ctenophore biomass was low and the
rations as well as daily grazing values were also low (Table 3). In summer and autumn the
biomass of zooplankton increased by a factor of 5–10; at the same time, the maximum
development of the ctenophore population occurred. The daily grazing value increased by 21
and 9% of zooplankton biomass. The ctenophore population could meet the minimum food
requirements in Sevastopol Bay for 3–10 days only. The ctenophores experienced a lack of
food, especially during the summer and autumn. This lack would have resulted in subsequent
decrease of M. leidyi population.
Table 3. Grazing of
zooplankton biomass by M.leidyi population in Sevastopol Bay during different seasons in
1995–1996
Season
|
Mean
zooplankton concentration,
mg of wet weight per m3 |
Percentage
of biomass grazed, % |
Ration,
% of body energy content |
Winter
(December-February) |
11.72±
18.9 |
0.10±
0.08 |
0.09±
0.17 |
Spring
(March-May) |
24.36±
22.6 |
0.05±
0.07 |
0.055±
0.09 |
Summer
(June-August) |
100.67±
90.77 |
21.30±
15.82 |
2.72±
3.21 |
Autumn
(September-November) |
117.38±
79.0 |
9.00±
6.44 |
3.17±
2.49 |
The study carried out in
Crimean coastal waters in spring 1999 (March–April ) showed that M. leidyi
biomass as well as the percentage of this species in gelatinous macroplankton total
biomass dropped in compare to spring 1995 (Fig.5).
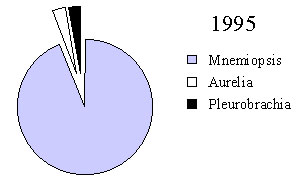
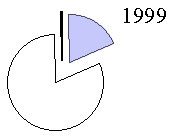

Figure 5. The
percentage of different species in the gelatinous zooplankton biomass in March–April
In August 1999 new alien ctenophore B.
ovata has appeared in Sevastopol Bay and adjacent water regions. As previous studies
showed this species feed on other ctenophores, in case of the Black Sea, almost
exclusively on M. leidyi.
We attempted to quantify the predatory
impact of B. ovata on M. leidyi population by studying feeding and
growth rates of Beroe in the laboratory along with abundance, biomass and
population structure of both ctenophore species from the shallow waters of the Black Sea.
The Beroe was available in
plankton of Sevastopol Bay during 3 months (September–November) in 1999 and 2000. It
appeared in the moment of maximum M.leidyi biomass. (Fig. 6 a,b) . Dynamics of M.
leidyi population for these years was similar to that in 1995. From winter to
beginning of summer (mid July) M. leidyi abundance was very low; the large animals
of 20-50 mm were the most numerous. M. leidyi over-wintered began reproduction at
the end of August or beginning of September in 2000; in 1999 it was earlier. Reproduction
continued until October- beginning of November. Juvenile ctenophores < 10mm comprised
about 60-90% population abundance at this time in both years. Later, in November-December
animals of 15-35 mm were the most numerous. In 2000 maximum biomass and maximum abundance
(860 ind m–2, 210 g m–2) were observed at the beginning of
September. Maximum wet weight of M. leidyi in population in 2000 was much
higher (near 20 g) of that in 1995 (4 g)(Fig.6c).
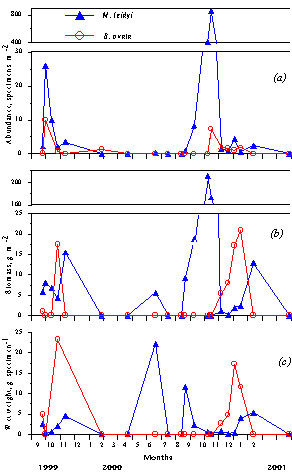
Figure 6. Abundance
(a), biomass (b), wet weight (c) of M. leidyi and B. ovata in 1999–2001
In 2000 after B. ovata appearance
average values for summer – autumn period of M. leidyi abundance (143±302 ind/m2)
reduced 8 times and biomass (50±82 g/m2 ) 5 times in
compare with 1995 (1100±920 ind/m2 and 230±173 g/m2) .
Size spectrum of animals was wider in 2000: maximum length was 35–40 mm against 15 mm in
1995
Abundance of M. leidyi has dropped
sharply when Beroe appeared in mid September (later than it was in 1999) and
remained at low level till December. In compare with 1995 when M. leidyi abundance
declined three times in relation to maximum value due to natural mortality or carrying out
to sea, in 2000 it decreased more than 2 orders of values due to additional predatory
impact of Beroe .
In 2000 B. ovata has appeared
firstly in mid September and the population was made up of juvenile ctenophores less than
10 mm. To beginning of November ( about 2 months later) large animals (30-50 mm) in the
population were the most abundant. To mid November a share of the largest ctenophores
(50-70 mm) increased and relative abundance of small ones (10-30 mm) dropped. At this time
maximum biomass as well as maximum weight of animal in the population was observed ( Fig
6, b, c). To mid December Beroe disappeared from plankton..
In laboratory experiments the ingestion
rate of juvenile and adult B. ovata is proportional to food concentration over an
extremely wide range of prey concentration up to the highest experimental densities used
(Fig.7a,b). The daily ration ranged from 5% to 330% of body wet weight.
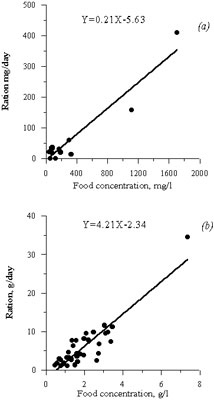
Figure 7. Effect of
food concentration on daily ration injuvenile (a) and adult (b) B. ovata
Specific ration value ( it is a function
of food concentration and animal body weight ) is an important factor that affects on
growth rate. Fig. 8 shows that at specific ration less than 20% of body weight the
ctenophores growth stopped. Food concentration 1.7 g/l was sufficient for growth of Beroe
less than 20 g, but larger ctenophores need higher food concentrations for growth.
The daily ration of the B. ovata
in the field and its predatory impact on the M. leidyi population were assessed via
ingestion and growth rates from laboratory experiments.
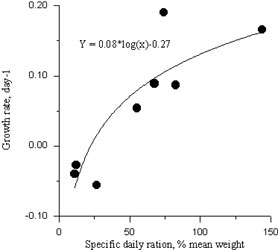
Figure 8. Effect of specific ration on growth rate in adult B. ovata
If we suggest that specific ration of B.
ovata was 20% of their weight (as it was in the experiments) and 20% of the population
had any food in their guts the grazing impact would be as much as 10- 35% of M. leidyi
population in a day. A comparison of maximum daily specific growth rate of the M.
leidyi population that occurs during the period of intensive growth and reproduction
in Sevastopol Bay (9.3%) with predatory impact of B. ovata on population of M.
leidyi (10-35%) showed that in inshore waters of the Black Sea the new alien
population may control abundance of their prey population. Sharp decrease of abundance and
biomass of M. leidyi during the period when B. ovata occurs in the
bay testify that B. ovata population does control the M. leidyi
population in Sevastopol Bay.
It is very important that predatory
impact of M. leidyi population on fodder zooplankton in 1999-2000 was very low:
only during August-September grazing rate of M. leidyi population was about 6-8% of
zooplankton biomass daily, during another months it was less then 1%.
Conclusions.
In 2000 after B. ovata appearance
average values for summer – autumn period of M. leidyi abundance (143±302
ind/m2) reduced 8 times and biomass (50±82 g/m2 ) 5
times in compare with 1995 (1100±920 ind/m2 and 230±173 g/m2)
. Size spectrum of animals was wider in 2000: maximum length was 35–40 mm against
15 mm in 1995.
Predatory impact of M. leidyi
population on fodder zooplankton in 2000 is low: only during August-September predatory
rate was 6-8 % of zooplankton biomass daily; during another months it was less than 1%.
Predation by the ctenophore B. ovata
(10-35% of M. leidyi biomass daily) is an important factor
controlling the M. leidyi population in the inshore waters of the Black Sea.
|
