Your query returned 23 graphics.
Results 1 - 15
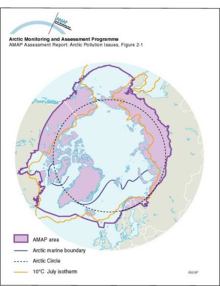
Arctic boundaries (physical)The Arctic as defined by temperature, and the Arctic marine boundary, also showing the boundary of the AMAP assessment area |
|
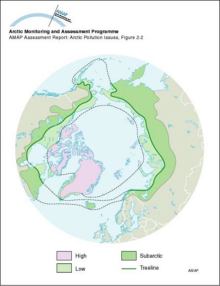
Arctic boundaries (floristic)Arctic and subarctic floristic boundaries |
|
Schematic representation of the temperature and salinity structure of the upper Arctic Ocean and how the halocline layer is maintained by brine-rich water produced on the shelvesSchematic representation of the temperature and salinity structure of the upper Arctic Ocean and how the halocline layer is maintained by brine-rich water produced on the shelves |

|
Lower stratospheric temperature record since 1979Lower stratospheric temperature record since 1979 |

|
Lower stratospheric (ca 120-40 hPa) Arctic temperature trends (°C per decade, January 1979 to February 1996), as monitored by MSUs on polar orbiting satellitesLower stratospheric (ca 120-40 hPa) Arctic temperature trends (°C per decade, January 1979 to February 1996), as monitored by MSUs on polar orbiting satellites |

|
Lower tropospheric Arctic temperature trends (°C per decade, January 1979 to February 1996), as monitored by MSUs on polar orbiting satellitesLower tropospheric Arctic temperature trends (°C per decade, January 1979 to February 1996), as monitored by MSUs on polar orbiting satellites |

|
Distribution of potential temperature, salinity, and density across the Arctic Ocean and the Greenland and Norwegian SeasDistribution of potential temperature, salinity, and density across the Arctic Ocean and the Greenland and Norwegian Seas |

|
Temperature and salinity of the Labrador Sea The cold freshwater from the Arctic Ocean and Baffin Bay is seen above the continental shelfTemperature and salinity of the Labrador Sea The cold freshwater from the Arctic Ocean and Baffin Bay is seen above the continental shelf |

|
Seasonal and annual average surface temperature trends (°C per decade) over the northern hemisphereSeasonal and annual average surface temperature trends (°C per decade) over the northern hemisphere |

|
History of temperature changes in central Greenland over the last 40 000 years, from the GISP2 core, showing very large and probably abrupt changesHistory of temperature changes in central Greenland over the last 40 000 years, from the GISP2 core, showing very large and probably abrupt changes |

|
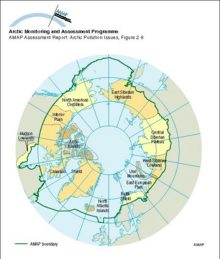
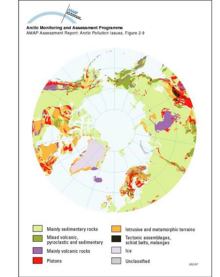
Arctic geologic and physiographic regionsGeologic and physiographic regions of the Arctic |
|
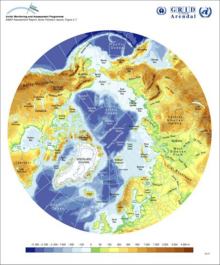
Arctic topography and bathymetryTopography and bathymetry of the Arctic (based on the ETOPO5 data set) |
|
Arctic geologyBedrock geology of the Arctic |
|
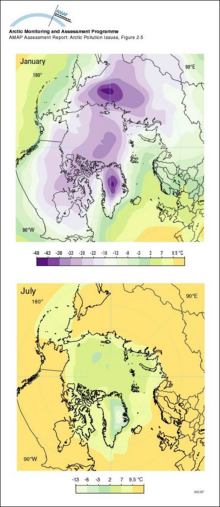
Arctic surface air temperatureMean January and July surface air temperatures (°C) in the Arctic |
|
An example of a positive feedback loop Warming leads to a decrease in sea ice cover which in turn leads to a decrease in albedo over the ocean, the result of which is further warming and further decreases in the sea ice coverAn example of a positive feedback loop Warming leads to a decrease in sea ice cover which in turn leads to a decrease in albedo over the ocean, the result of which is further warming and further [..] |

|

water OR waste searches for either of these words
oceans AND biodiversity searches for blocks with both words
pollution NEAR water searches for blocks with either of these words, with them being closer ranks higher
"climate change" searches for this phrase