Your query returned 206 graphics.
Results 181 - 195
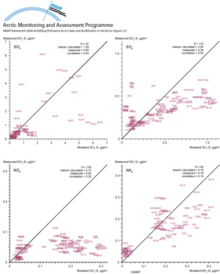
Scatterplots comparing measured and modeled annual average concentrations of sulfur dioxide, sulfate, nitrate and ammoniumScatterplots comparing measured and modeled annual average concentrations of sulfur dioxide, sulfate, nitrate and ammonium at arctic monitoring stations for 1991 to 2000. Labels on graphs refer to [..] |
|
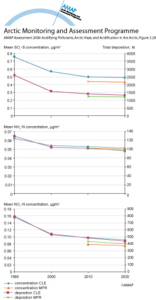
Total mean concentrations and total depositions of sulfur oxides, reduced nitrogen and airborne oxidized nitrogenTotal mean concentrations and total depositions of sulfur oxides, reduced nitrogen (NHX) and airborne oxidized nitrogen (NOy) for the area north of Arctic Circle for six emissions scenarios |
|
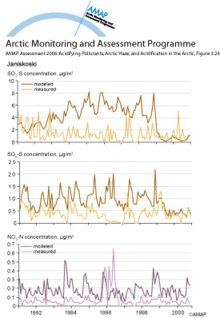
Time series of measured and modeled monthly concentrations of sulfur dioxide, sulfate, and nitrate at JaniskoskiTime series of measured and modeled monthly concentrations of sulfur dioxide, sulfate, and nitrate at Janiskoski, Russia |
|
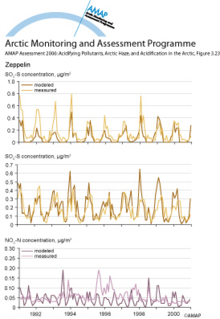
Time series of measured and modeled monthly concentrations of sulfur dioxide, sulfate, and nitrate at ZeppelinTime series of measured and modeled monthly concentrations of sulfur dioxide, sulfate, and nitrate at Zeppelin, Spitsbergen |
|
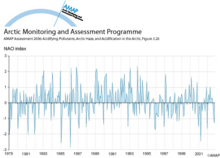
NAO index for the period 1979 to 2002NAO index for the period 1979 to 2002 |
|
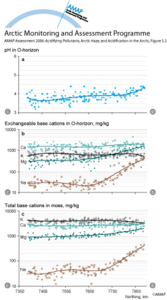
Transect south–north across the survey area near the western boundary in 1995Transect south–north across the survey area near the western boundary in 1995, showing: (a) pH in a water extract of the O-horizon; (b) ammonium acetate extractable (pH 4.5) base cation concentrations [..] |

|
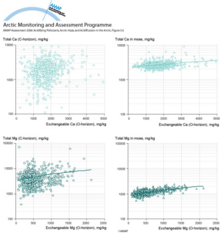
Ammonium acetate extractable Ca and Mg in the O-horizon of soilsAmmonium acetate extractable Ca and Mg in the O-horizon of soils (x-axis) vs. their total concentrations (aqua regia extractable) in the C-horizon of soils and in moss in 1995 |
|
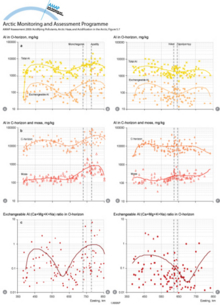
A comparison of the two west–east transects across the survey area in 1995A comparison of the two west–east transects across the survey area in 1995, showing changes from east to west in (a) total Al (nitric acid) and exchangeable Al concentrations in the O-horizon; (b) [..] |
|
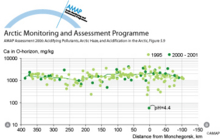
Transect west–east across the survey area showing exchangeable Ca in the O-horizon of podzol soils in 1995 and from 2000 to 2001Transect west–east across the survey area showing exchangeable Ca in the O-horizon of podzol soils in 1995 (Kola Ecogeochemistry Project) and from 2000 to 2001 (Barents Ecogeochemistry Project) |
|
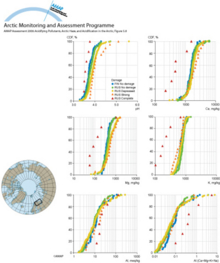
Cumulative distribution functions (CDF, %) of pH (water extraction)Cumulative distribution functions (CDF, %) of pH (water extraction), exchangeable Ca, Mg, K, and Al concentrations and the exchangeable Al:(Ca+Mg+K+Na) ratio in the O-horizon in the ‘no visual damage’ [..] |
|
Transect south–north across the survey area near the western boundary in 1995Transect south–north across the survey area near the western boundary in 1995 (C–D on Figure 5.2), showing: (a) pH in a water extract of the O-horizon; (b) ammonium acetate extractable (pH 4.5) base [..] |
|
Visible (acute) SO2 injuries on (a) birch leaves and (b) Scots pine needles at SvanvikVisible (acute) SO2 injuries on (a) birch (Betula pubescens) leaves and (b) Scots pine (Pinus sylvestris) needles at Svanvik, Norway, approximately 10 km northwest of Nikel |

|
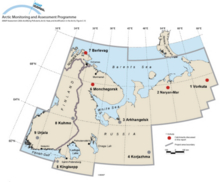
Location of the catchments included in the Barents ProjectLocation of the catchments included in the Barents Project |
|
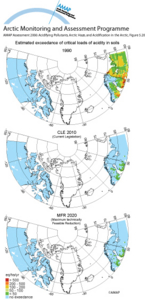
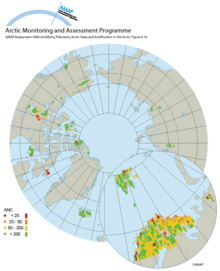
Estimated exceedance of critical loads of acidity for soils for three emission/deposition scenariosEstimated exceedance of critical loads of acidity for soils for three emission/deposition scenarios: 1990 emissions, the CLE scenario for 2010 (CLE, 2010), and the MFR scenario for 2020 (MFR, 2020). |
|
Median values for a selection of key chemical variablesMedian values for a selection of key chemical variables including the calculated critical load of acidity CLAc and exceedance |
|

water OR waste searches for either of these words
oceans AND biodiversity searches for blocks with both words
pollution NEAR water searches for blocks with either of these words, with them being closer ranks higher
"climate change" searches for this phrase