Your query returned 206 graphics.
Results 46 - 60
Scatterplots for comparisons between the average concentrations of SO2 and SO4 in air from October 1990 to December 1993 as monitored by the European Monitoring and Evaluation Programme (EMEP) and calculated by Christensen (1996)Scatterplots for comparisons between the average concentrations of SO2 and SO4 in air from October 1990 to December 1993 as monitored by the European Monitoring and Evaluation Programme (EMEP) and [..] |

|
Calculated concentrations of SO2 and SO42- compared with measurements at Station Nord in northeastern GreenlandCalculated concentrations of SO2 and SO42- compared with measurements at Station Nord in northeastern Greenland |

|
The predicted (1988) average surface air sulfate concentrations in the ArcticThe predicted (1988) average surface air sulfate concentrations in the Arctic |

|
The predicted (1988) average surface air sulfur dioxide concentrations in the ArcticThe predicted (1988) average surface air sulfur dioxide concentrations in the Arctic |

|
(a) Vertical distribution of SOx (SO2 + SO42-) concentrations averaged over the area north of 75°N, and (b) contributions from the different sources(a) Vertical distribution of SOx (SO2 + SO42-) concentrations averaged over the area north of 75°N, and (b) contributions from the different sources |

|
Model calculations of ground level yearly average sulfur dioxide air concentration on the Kola PeninsulaModel calculations of ground level yearly average sulfur dioxide air concentration on the Kola Peninsula |

|
Summer and winter visibility observations (for relative humidities less than 80%) for the period 1951 to 1993 in North AmericaSummer and winter visibility observations (for relative humidities less than 80%) for the period 1951 to 1993 in North America |

|
The time series of light scattering (?sp) and optical depth (?) at 500 nm at Barrow, AlaskaThe time series of light scattering (?sp) and optical depth (?) at 500 nm at Barrow, Alaska |

|
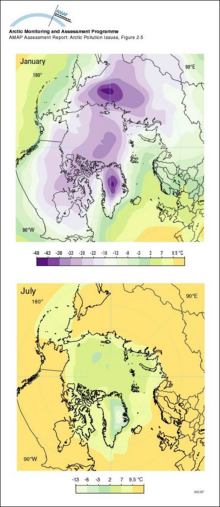
Arctic surface air temperatureMean January and July surface air temperatures (°C) in the Arctic |
|
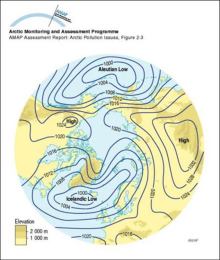
Arctic sea-level atmospheric pressure (January)Mean atmospheric sea-level pressure (mb) in the Arctic in January |
|
Trends in concentration of major organochlorines in blubber of female ringed seals over 6 to 10 years at 3 sites in the eastern Canadian Arctic (N=10-14 animals for each year/site)Trends in concentration of major organochlorines in blubber of female ringed seals over 6 to 10 years at 3 sites in the eastern Canadian Arctic (N=10-14 animals for each year/site) |

|
Changes with time in European atmospheric emissions of Cd, Pb and ZnChanges with time in European atmospheric emissions of Cd, Pb and Zn |

|
Averaged upper (3000 m) air concentrations of Pb in winter (December-February) and summer (June-August) as modeled by the updated (1996) hemispheric EMEP transport model in a simulation for the reference year 1988Averaged upper (3000 m) air concentrations of Pb in winter (December-February) and summer (June-August) as modeled by the updated (1996) hemispheric EMEP transport model in a simulation for the [..] |

|
Average contributions from various sources to the atmospheric concentrations of elements in winter air samples at Ny-Ålesund, SvalbardAverage contributions from various sources to the atmospheric concentrations of elements in winter air samples at Ny-Ålesund, Svalbard |

|
Average regional source apportionment of metals in winter aerosol at Ny-Ålesund, Svalbard from Europe and the central part of the former Soviet Union (including the Urals and Norilsk)Average regional source apportionment of metals in winter aerosol at Ny-Ålesund, Svalbard from Europe and the central part of the former Soviet Union (including the Urals and Norilsk) |
|

water OR waste searches for either of these words
oceans AND biodiversity searches for blocks with both words
pollution NEAR water searches for blocks with either of these words, with them being closer ranks higher
"climate change" searches for this phrase