Your query returned 206 graphics.
Results 121 - 135
Lower stratospheric (ca 120-40 hPa) Arctic temperature trends (°C per decade, January 1979 to February 1996), as monitored by MSUs on polar orbiting satellitesLower stratospheric (ca 120-40 hPa) Arctic temperature trends (°C per decade, January 1979 to February 1996), as monitored by MSUs on polar orbiting satellites |

|
Lower tropospheric Arctic temperature trends (°C per decade, January 1979 to February 1996), as monitored by MSUs on polar orbiting satellitesLower tropospheric Arctic temperature trends (°C per decade, January 1979 to February 1996), as monitored by MSUs on polar orbiting satellites |

|
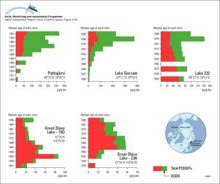
Dose estimates based on wholebody measurements (see Figure 836) for two groups (northern Saami and southern Saami) of Norwegian reindeer-breeding SaamiDose estimates based on wholebody measurements (see Figure 836) for two groups (northern Saami and southern Saami) of Norwegian reindeer-breeding Saami |

|
Predicted release rates of different radionuclide groups from the submarine reactor dumped in the Novaya Zemlya Trough (best estimate scenario)Predicted release rates of different radionuclide groups from the submarine reactor dumped in the Novaya Zemlya Trough (best estimate scenario) |

|
Changes with time in 137Cs contamination in the food chain lichen - reindeer - humansChanges with time in 137Cs contamination in the food chain lichen - reindeer - humans |

|
Temporal variation in calculated reindeer Tag values for different Arctic regionsTemporal variation in calculated reindeer Tag values for different Arctic regions |

|
Temporal variation in cow milk Tag values for Sweden, Norway and FinlandTemporal variation in cow milk Tag values for Sweden, Norway and Finland |

|
Concentration (pg/g dw) profiles for octachlorodioxin (OCDD) and total PCDD/Fs in dated sediment cores from Arctic Canada and Finland Sum-PCDD/Fs = sum of 2,3,7,8-substituted tetra- to octachloro D/Fs plus non-2,3,7,8-substituted congenersConcentration (pg/g dw) profiles for octachlorodioxin (OCDD) and total PCDD/Fs in dated sediment cores from Arctic Canada and Finland Sum-PCDD/Fs = sum of 2,3,7,8-substituted tetra- to octachloro D/Fs [..] |
|
Contaminant emissions, transport and deposition in the ArcticAn illustration of the interplay between a) contaminant emissions distribution for sulfur dioxide and b) frequency of atmospheric south-to-north transport, yielding c) a net annual input of sulfur to [..] |

|
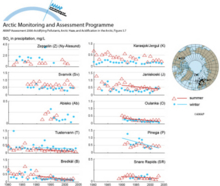
Trends in weighted summer and winter sulfate concentrations in precipitation within the ArcticTrends in weighted summer and winter sulfate concentrations in precipitation within the Arctic |
|
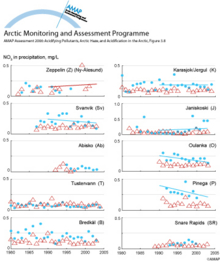
Trends in weighted summer and winter nitrate concentrations in precipitation within the ArcticTrends in weighted summer and winter nitrate concentrations in precipitation within the Arctic |
|
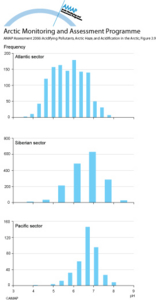
Frequency distribution for monthly pH values in precipitation within the Russian Arctic for the AtlanticFrequency distribution for monthly pH values in precipitation within the Russian Arctic for the Atlantic, Siberian, and Pacific sectors for 1990 to 2004 |
|
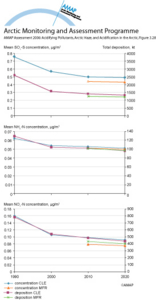
Total mean concentrations and total depositions of sulfur oxides, reduced nitrogen and airborne oxidized nitrogenTotal mean concentrations and total depositions of sulfur oxides, reduced nitrogen (NHX) and airborne oxidized nitrogen (NOy) for the area north of Arctic Circle for six emissions scenarios |
|
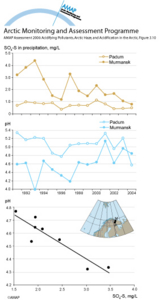
Annual average sulfate sulfur concentrations and pH in precipitation within the Russian ArcticAnnual average sulfate sulfur concentrations and pH in precipitation within the Russian Arctic at a heavily impacted site (Murmansk) and a background site (Padun) since 1991, and the correlation [..] |
|
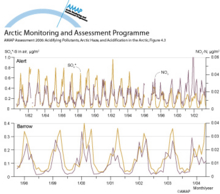
Time series of monthly averaged particulate sulfate and nitrate concentrations at Alert and BarrowTime series of monthly averaged particulate sulfate and nitrate concentrations at Alert (Canada) and Barrow (Alaska) |
|

water OR waste searches for either of these words
oceans AND biodiversity searches for blocks with both words
pollution NEAR water searches for blocks with either of these words, with them being closer ranks higher
"climate change" searches for this phrase