Your query returned 218 graphics.
Results 151 - 165
SMART model results for selected soil and lake output variables at Christmas lakes for the past 90 years and for three future scenarios assuming a 0%, 70% and 95% reduction of the present sulfur deposition levelsSMART model results for selected soil and lake output variables at Christmas lakes for the past 90 years and for three future scenarios assuming a 0%, 70% and 95% reduction of the present sulfur [..] |

|
MAGIC model results for the streamwater at Dalelva for the past 90 years and for three future scenarios assuming a 0%, 70%, and 95% reduction of the present sulfur deposition levelsMAGIC model results for the streamwater at Dalelva for the past 90 years and for three future scenarios assuming a 0%, 70%, and 95% reduction of the present sulfur deposition levels |

|
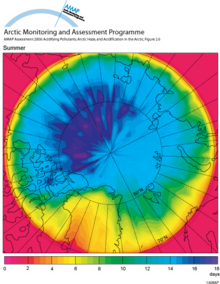
Mean arctic age of air in the lowest 100 m of the atmosphere (summer)Mean arctic age of air in the lowest 100 m of the atmosphere in July (summer) |
|
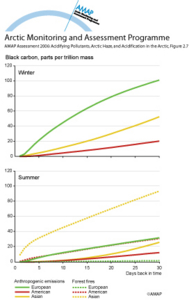
Black carbon potential source contributionsBlack carbon potential source contributions from continents as a function of transport time to the Arctic, for the subset that also reaches a minimum arctic altitude below 1000 m, for winter and [..] |
|
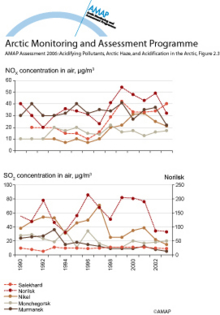
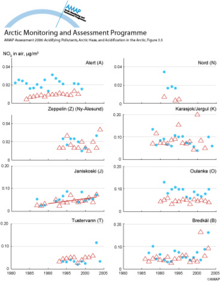
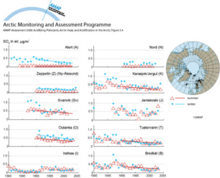
Trends in NOx and SO2 concentrationsTrends in NOx and SO2 concentrations in air in various cities in the Russian Arctic |
|
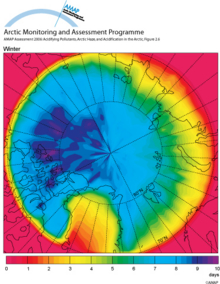
Mean arctic age of air in the lowest 100 m of the atmosphere (winter)Mean arctic age of air in the lowest 100 m of the atmosphere in January (winter) |
|
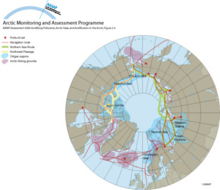
Shipping routes, oil and gas regions, and fishing grounds in the ArcticShipping routes, oil and gas regions, and fishing grounds in the Arctic |
|
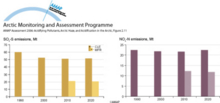
Projected total emissions of SOx-S and NOx-N between 1990 and 2020Projected total emissions of SOx-S and NOx-N between 1990 and 2020 |
|
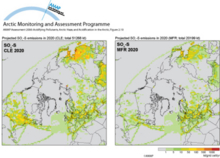
Projected SOx-S emissions in 2020 for the CLE and MFR emissions scenariosProjected SOx-S emissions in 2020 for the CLE and MFR emissions scenarios |
|
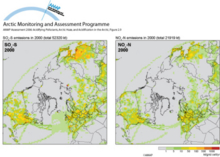
Estimated emissions of SOx-S and NOx-N in 2000Estimated emissions of SOx-S and NOx-N in 2000 |
|
Trends in summer and winter nitrate concentrations in air within the ArcticTrends in summer and winter nitrate concentrations in air within the Arctic |
|
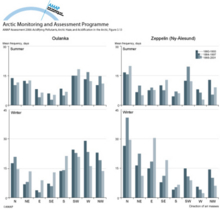
Frequency and variation in the direction of air massesFrequency and variation in the direction of air masses arriving at Oulanka and Zeppelin over 4-year periods during the 1990s |
|
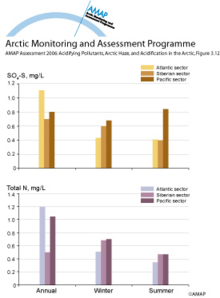
Annual and seasonal variations in average background levels of sulfate sulfur and total nitrogen in precipitation across the AtlanticAnnual and seasonal variations in average background levels of sulfate sulfur and total nitrogen in precipitation across the Atlantic, Siberian, and Pacific sectors of the Russian Arctic |
|
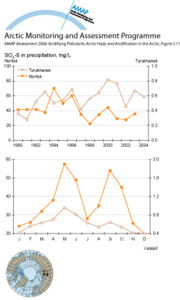
Annual and seasonal variations in sulfate sulfur concentrationsAnnual and seasonal variations in sulfate sulfur concentrations in an industrial area (Norilsk) and a background area (Turukhansk) of the Siberian sector of the Russian Arctic |
|
Trends in summer and winter total sulfate concentrations in air within the ArcticTrends in summer and winter total sulfate concentrations in air within the Arctic |
|

water OR waste searches for either of these words
oceans AND biodiversity searches for blocks with both words
pollution NEAR water searches for blocks with either of these words, with them being closer ranks higher
"climate change" searches for this phrase