|
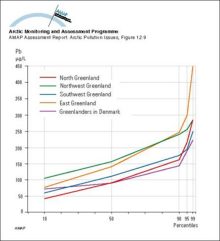
Distribution (in percentiles) of whole blood lead concentrations in four regions in Greenland and in Greenlanders living in Denmark
|
|
|
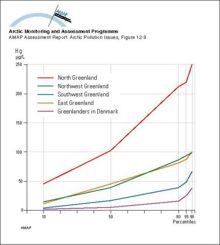
Distribution (in percentiles) of whole blood mercury concentrations in four regions in Greenland and in Greenlanders living in Denmark
|
|
|
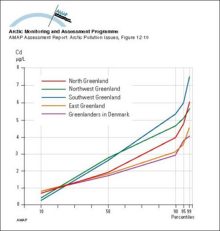
Distribution (in percentiles) of whole blood cadmium concentrations in four regions in Greenland and in Greenlanders living in Denmark
|
|
|
Scatterplots for comparisons between the average concentrations of SO2 and SO4 in air from October 1990 to December 1993 as monitored by the European Monitoring and Evaluation Programme (EMEP) and [..]
|

|
|
Calculated concentrations of SO2 and SO42- compared with measurements at Station Nord in northeastern Greenland
|

|
|
The predicted (1988) average surface air sulfate concentrations in the Arctic
|

|
|
The predicted (1988) average surface air sulfur dioxide concentrations in the Arctic
|

|
|
(a) Vertical distribution of SOx (SO2 + SO42-) concentrations averaged over the area north of 75°N, and (b) contributions from the different sources
|

|
|
Model calculations of ground level yearly average sulfur dioxide air concentration on the Kola Peninsula
|

|
|
Summer and winter visibility observations (for relative humidities less than 80%) for the period 1951 to 1993 in North America
|

|
|
The time series of light scattering (?sp) and optical depth (?) at 500 nm at Barrow, Alaska
|

|
|
Model calculations of sulfur deposition and fraction of dry deposition for the period July 1990 to June 1991 in northern Fennoscandia and the Kola Peninsula
|

|
|
(a) The contribution from the different sources to the total deposition, averaged over the area north of 75°N from October 1990 to May 1994, (b) the calculated total monthly depositions of SOx [..]
|

|
|
Model calculations of total (wet and dry) deposition estimates of sulfur for 1988
|

|
|
Vertical distribution of Arctic haze in summer, winter, and the whole year Sulfur air concentrations and relative source-contribution (%) for different heights above the ground are shown The [..]
|

|

water OR waste searches for either of these words
oceans AND biodiversity searches for blocks with both words
pollution NEAR water searches for blocks with either of these words, with them being closer ranks higher
"climate change" searches for this phrase