|
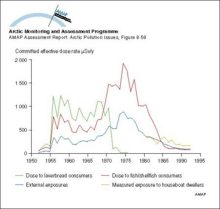
Comparison of doses to critical groups for Sellafield discharges from 1952 to 1993
|
|
|
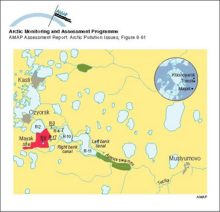
The system of dams and drainage channels at Mayak
|
|
|
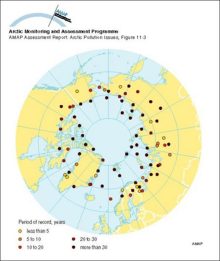
Locations of upper-air meteorological monitoring stations in the Arctic Meteorological station density for surface observations is greater for inland areas of the Arctic, while observations of any [..]
|
|
|
Lower tropospheric temperatures since 1979, from satellite monitoring High variability is characteristic of the Arctic region due to its isolation from the moderating influences of warm, lower [..]
|

|
|
Lower stratospheric (ca 120-40 hPa) Arctic temperature trends (°C per decade, January 1979 to February 1996), as monitored by MSUs on polar orbiting satellites
|

|
|
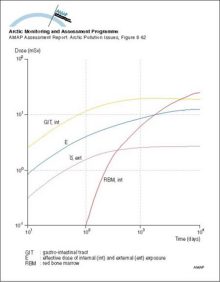
Dose accumulation in adult rural residents after the Kyshtym accident in 1957
|
|
|
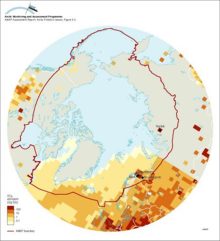
Lower tropospheric Arctic temperature trends (°C per decade, January 1979 to February 1996), as monitored by MSUs on polar orbiting satellites
|

|
|
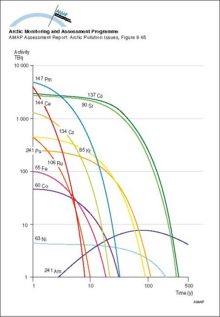
The changing inventory of major radionuclides in the Komsomolets reactor with time
|
|
|
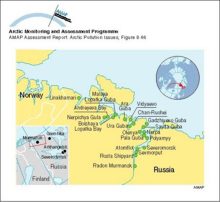
Major Russian naval bases along the Kola Peninsula and White Sea
|
|
|
Predicted release rates of different radionuclide groups from the submarine reactor dumped in the Novaya Zemlya Trough (best estimate scenario)
|

|
|
Locations of sea dumping of radioactive waste in the Russian Arctic
|

|
|
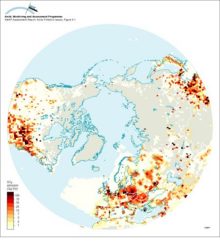
Anthropogenic SO2 emissions for 1985 north of 30°N
|
|
|
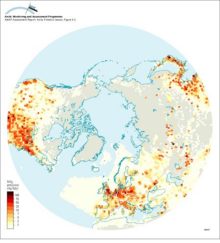
Anthropogenic NOx emissions for 1985 north of 30°N
|
|
|
SO2 emissions north of 50°N (modified after Benkovitz et al 1995, see Figure 91) showing point source emissions from Arctic and subarctic non-ferrous smelters and including natural DMS sources from [..]
|
|
|
Time series of emissions of SO2 from European sources (Mylona 1993) and two major sources on the Kola Peninsula
|

|

water OR waste searches for either of these words
oceans AND biodiversity searches for blocks with both words
pollution NEAR water searches for blocks with either of these words, with them being closer ranks higher
"climate change" searches for this phrase