Your query returned 112 graphics.
Results 76 - 90
Development of a type 1 ozone anomaly The series of satellite images show total column ozone for a period of days spanning 6-26 January 1996Development of a type 1 ozone anomaly The series of satellite images show total column ozone for a period of days spanning 6-26 January 1996 |

|
Trends in (annual average) ozone mixing ratio over Canada from 1980 to 1993Trends in (annual average) ozone mixing ratio over Canada from 1980 to 1993 |

|
Ozone soundings at Gardermoen, southern Norway, 27 January 1992 The green line denotes the partial pressure of ozone observed during the (type 1) anomaly, when low-ozone air passed over the areaOzone soundings at Gardermoen, southern Norway, 27 January 1992 The green line denotes the partial pressure of ozone observed during the (type 1) anomaly, when low-ozone air passed over the area |

|
An example of a type 2 ozone anomaly, showing levels of ozone depletion relative to the long-term meanAn example of a type 2 ozone anomaly, showing levels of ozone depletion relative to the long-term mean |

|
Ozone soundings at Sodankylä, Finland, 23 March 1995 The green line denotes the profile of partial pressure of ozone observed during the (type 2) anomaly The red line shows the monthly mean ozone profile for MarchOzone soundings at Sodankylä, Finland, 23 March 1995 The green line denotes the profile of partial pressure of ozone observed during the (type 2) anomaly The red line shows the monthly mean ozone [..] |

|
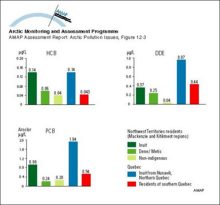
Geometric mean levels of HCB, DDE and PCBs in cord blood of newborns in different Canadian population groupsGeometric mean levels of HCB, DDE and PCBs in cord blood of newborns in different Canadian population groups |
|
Concentrations of PCB congeners in cord plasma from Nunavik and southern Quebec newbornsConcentrations of PCB congeners in cord plasma from Nunavik and southern Quebec newborns |
|
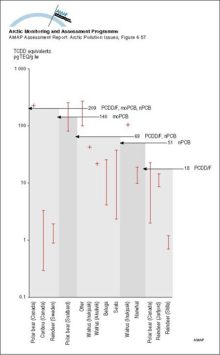
Body concentrations of PCDD/F and non-ortho and mono-ortho PCBs as TCDD equivalents (pg/g lw) in Arctic mammals compared to thresholds for immunosuppression in harbor seal for the same combinations of substances analyzedBody concentrations of PCDD/F and non-ortho and mono-ortho PCBs as TCDD equivalents (pg/g lw) in Arctic mammals compared to thresholds for immunosuppression in harbor seal for the same combinations of [..] |
|
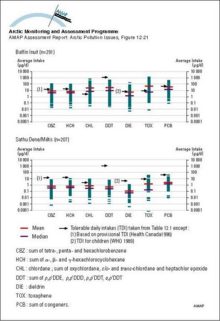
Organochlorine intake from traditional food consumed by indigenous women in the Canadian ArcticOrganochlorine intake from traditional food consumed by indigenous women in the Canadian Arctic |
|
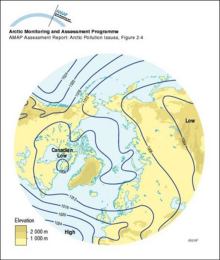
Arctic sea-level atmospheric pressure (July)Mean atmospheric sea-level pressure (mb) in the Arctic in July |
|
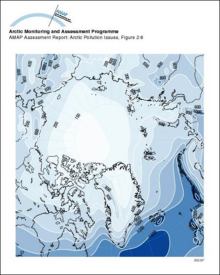
Precipitation in the ArcticDistribution of precipitation (mm/y) in the Arctic |
|
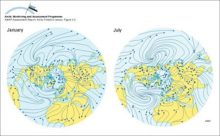
Arctic atmospheric circulationThe mean circulation of the lower atmosphere during January and July as depicted by mean streamlines of the resultant winds |
|
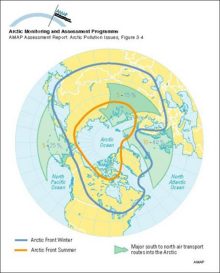
Arctic air masses and atmospheric transport routesThe mean position of the Arctic air mass in winter (January) and summer (July), superimposed on the (summer value % (orange) - winter value % (blue)) frequency of major south-to-north transport routes [..] |
|
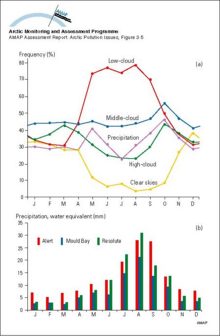
Cloud cover and precipitation in the Canadian High ArcticSeasonal variation in a) cloud cover and precipitation occurrence and b) precipitation amount in the Canadian High Arctic, 1951-1980 norms |
|
Atmosphere-surface exchangeSchematic diagram of processes of atmosphere-surface exchange |

|

water OR waste searches for either of these words
oceans AND biodiversity searches for blocks with both words
pollution NEAR water searches for blocks with either of these words, with them being closer ranks higher
"climate change" searches for this phrase