Your query returned 140 graphics.
Results 16 - 30
Temporal trends in concentrations of sum-HCH and toxaphene in Arctic airTemporal trends in concentrations of sum-HCH and toxaphene in Arctic air |

|
Temporal trends in PCB and DDT levels (µg/g lw ± 95% confidence limits) of otter muscle in Sweden Levels are based on means of 26, 16, and 28 samples (northern Sweden) and 29, 9, and 15 samples (southern Sweden)Temporal trends in PCB and DDT levels (µg/g lw ± 95% confidence limits) of otter muscle in Sweden Levels are based on means of 26, 16, and 28 samples (northern Sweden) and 29, 9, and 15 samples [..] |

|
Historical profiles of PCBs (trichloro- and all other) in slices from dated sediment cores in Alaska, Canada, and Finland Median age of each slice is given on the vertical axis The green lines indicate the source function of PCBsHistorical profiles of PCBs (trichloro- and all other) in slices from dated sediment cores in Alaska, Canada, and Finland Median age of each slice is given on the vertical axis The green lines [..] |

|
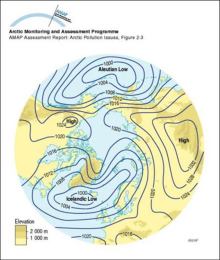
Arctic sea-level atmospheric pressure (January)Mean atmospheric sea-level pressure (mb) in the Arctic in January |
|
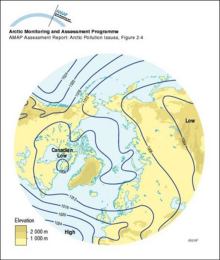
Arctic sea-level atmospheric pressure (July)Mean atmospheric sea-level pressure (mb) in the Arctic in July |
|
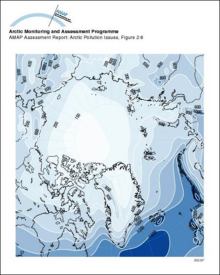
Precipitation in the ArcticDistribution of precipitation (mm/y) in the Arctic |
|
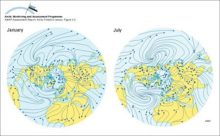
Arctic atmospheric circulationThe mean circulation of the lower atmosphere during January and July as depicted by mean streamlines of the resultant winds |
|
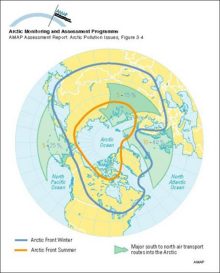
Arctic air masses and atmospheric transport routesThe mean position of the Arctic air mass in winter (January) and summer (July), superimposed on the (summer value % (orange) - winter value % (blue)) frequency of major south-to-north transport routes [..] |
|
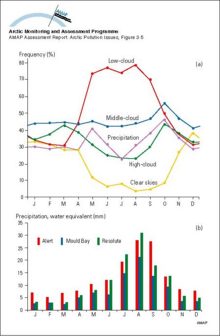
Cloud cover and precipitation in the Canadian High ArcticSeasonal variation in a) cloud cover and precipitation occurrence and b) precipitation amount in the Canadian High Arctic, 1951-1980 norms |
|
Atmosphere-surface exchangeSchematic diagram of processes of atmosphere-surface exchange |

|
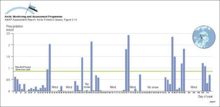
Precipitation rate measurements from Alert from January through April 1992 showing periods of no snow, periods of no snow measured due to wind events, and the relatively large quantities of precipitation on days duringPrecipitation rate measurements from Alert from January through April 1992 showing periods of no snow, periods of no snow measured due to wind events, and the relatively large quantities of [..] |
|
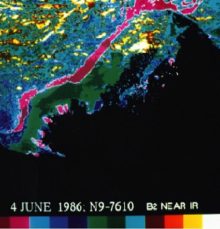
Advanced Very High Resolution Radiometer (AVHRR) satellite image (June 4, 1986) showing a color composite of the visible data band for the Mackenzie Delta River water overflowing the landfast ice can be seen as purple regionsAdvanced Very High Resolution Radiometer (AVHRR) satellite image (June 4, 1986) showing a color composite of the visible data band for the Mackenzie Delta River water overflowing the landfast ice can [..] |
|
Dose estimates based on wholebody measurements (see Figure 836) for two groups (northern Saami and southern Saami) of Norwegian reindeer-breeding SaamiDose estimates based on wholebody measurements (see Figure 836) for two groups (northern Saami and southern Saami) of Norwegian reindeer-breeding Saami |

|
Predicted release rates of different radionuclide groups from the submarine reactor dumped in the Novaya Zemlya Trough (best estimate scenario)Predicted release rates of different radionuclide groups from the submarine reactor dumped in the Novaya Zemlya Trough (best estimate scenario) |

|
Changes with time in 137Cs contamination in the food chain lichen - reindeer - humansChanges with time in 137Cs contamination in the food chain lichen - reindeer - humans |

|

water OR waste searches for either of these words
oceans AND biodiversity searches for blocks with both words
pollution NEAR water searches for blocks with either of these words, with them being closer ranks higher
"climate change" searches for this phrase