Your query returned 140 graphics.
Results 121 - 135
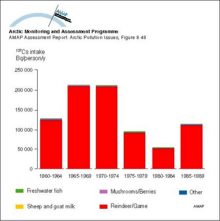
Yearly intake of 137Cs from various dietary components by the ‘selected’ population of Arctic NorwayYearly intake of 137Cs from various dietary components by the ‘selected’ population of Arctic Norway |
|
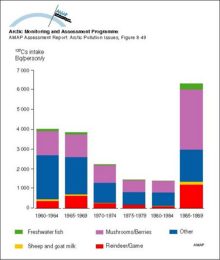
Yearly intake of 137Cs from various dietary components by the average population of Arctic SwedenYearly intake of 137Cs from various dietary components by the average population of Arctic Sweden |
|
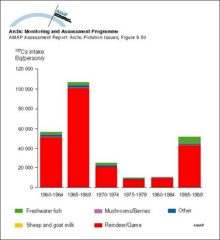
Yearly intake of 137Cs from various dietary components by the ‘selected’ population of Arctic SwedenYearly intake of 137Cs from various dietary components by the ‘selected’ population of Arctic Sweden |
|
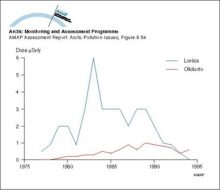
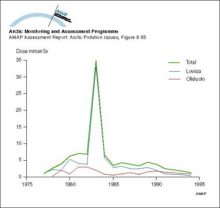
Annual radiation doses to critical groups from the Loviisa and Olkiluoto NPP’sAnnual radiation doses to critical groups from the Loviisa and Olkiluoto NPP’s |
|
Collective doses from the Loviisa and Olkiluoto NPP’sCollective doses from the Loviisa and Olkiluoto NPP’s |
|
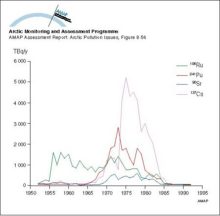
Discharges of principle beta-gamma emitters in liquid effluent from Sellafield, 1952-1992Discharges of principle beta-gamma emitters in liquid effluent from Sellafield, 1952-1992 |
|
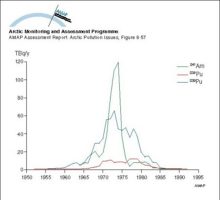
Discharges of principle alpha emitters in liquid effluent from Sellafield, 1952-1992Discharges of principle alpha emitters in liquid effluent from Sellafield, 1952-1992 |
|
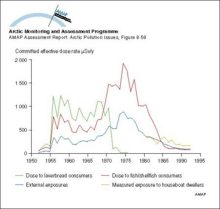
Comparison of doses to critical groups for Sellafield discharges from 1952 to 1993Comparison of doses to critical groups for Sellafield discharges from 1952 to 1993 |
|
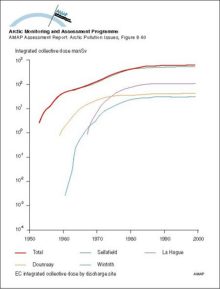
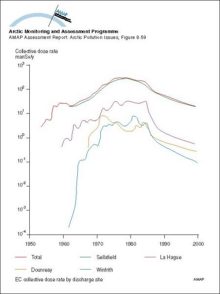
Collective dose rates from European nuclear fuel reprocessing plants based on releases up to 1986Collective dose rates from European nuclear fuel reprocessing plants based on releases up to 1986 |
|
Collective dose commitment from nuclear fuel reprocessing activitiesCollective dose commitment from nuclear fuel reprocessing activities |
|
An example of a positive feedback loop Warming leads to a decrease in sea ice cover which in turn leads to a decrease in albedo over the ocean, the result of which is further warming and further decreases in the sea ice coverAn example of a positive feedback loop Warming leads to a decrease in sea ice cover which in turn leads to a decrease in albedo over the ocean, the result of which is further warming and further [..] |

|
The hydrologic balance in the Arctic is highly dynamic on the seasonal time scale with large and rapid ice melts in the spring On land, this ice and snow melting results in large rapid floods and surges in riversThe hydrologic balance in the Arctic is highly dynamic on the seasonal time scale with large and rapid ice melts in the spring On land, this ice and snow melting results in large rapid floods and [..] |

|
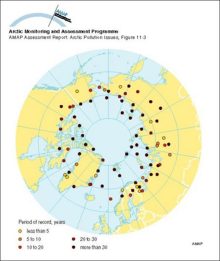
Locations of upper-air meteorological monitoring stations in the Arctic Meteorological station density for surface observations is greater for inland areas of the Arctic, while observations of any kind are sparse over the Arctic OceanLocations of upper-air meteorological monitoring stations in the Arctic Meteorological station density for surface observations is greater for inland areas of the Arctic, while observations of any [..] |
|
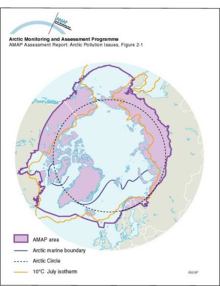
Arctic boundaries (physical)The Arctic as defined by temperature, and the Arctic marine boundary, also showing the boundary of the AMAP assessment area |
|
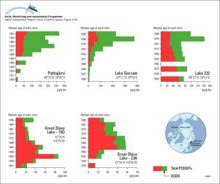
Concentration (pg/g dw) profiles for octachlorodioxin (OCDD) and total PCDD/Fs in dated sediment cores from Arctic Canada and Finland Sum-PCDD/Fs = sum of 2,3,7,8-substituted tetra- to octachloro D/Fs plus non-2,3,7,8-substituted congenersConcentration (pg/g dw) profiles for octachlorodioxin (OCDD) and total PCDD/Fs in dated sediment cores from Arctic Canada and Finland Sum-PCDD/Fs = sum of 2,3,7,8-substituted tetra- to octachloro D/Fs [..] |
|

water OR waste searches for either of these words
oceans AND biodiversity searches for blocks with both words
pollution NEAR water searches for blocks with either of these words, with them being closer ranks higher
"climate change" searches for this phrase