Your query returned 97 graphics.
Results 1 - 15
Illustration of the concept of a) the 'zone of influence' through major contaminant pathways from a major source region, and b) the 'contaminant focussing zone' resulting from the convergence of pathways carrying contaminants from a variety of sourcesIllustration of the concept of a) the 'zone of influence' through major contaminant pathways from a major source region, and b) the 'contaminant focussing zone' resulting from the convergence of [..] |

|
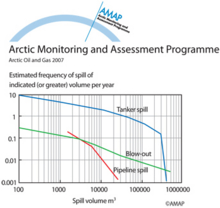
Relationship between frequency and volume of releases to the marine environment from different sources (worldwide)Relationship between frequency and volume of releases to the marine environment from different sources (worldwide) |
|
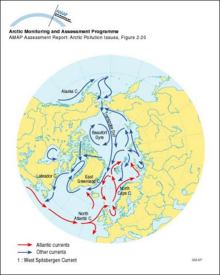
Surface ocean currents in the ArcticSurface ocean currents in the Arctic |
|
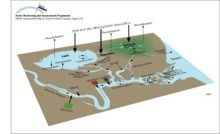
Major pathways of contaminants into and within the Arctic environmentA multi-compartment schematic diagram of the major pathways of contaminants into and within the Arctic environment |

|
Contaminant emissions, transport and deposition in the ArcticAn illustration of the interplay between a) contaminant emissions distribution for sulfur dioxide and b) frequency of atmospheric south-to-north transport, yielding c) a net annual input of sulfur to [..] |

|
Conceptual model of the terrestrial/freshwater compartment showing the main subcompartments and contaminant transfers, and exchanges with the atmosphere and oceansConceptual model of the terrestrial/freshwater compartment showing the main subcompartments and contaminant transfers, and exchanges with the atmosphere and oceans |
|
Conceptual model of the coastal zone and marine environments showing the main subcompartments and contaminant transfers, and exchanges with the atmosphereConceptual model of the coastal zone and marine environments showing the main subcompartments and contaminant transfers, and exchanges with the atmosphere |

|
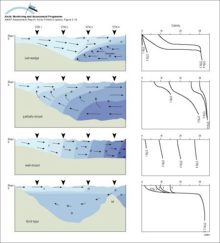
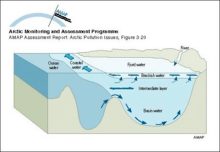
Basic circulation and salinity distribution in salt wedge, partially-mixed, well-mixed and fjord-type estuaries as defined by Wollast and Duinker (1982) Numbers and shading show salinity valuesBasic circulation and salinity distribution in salt wedge, partially-mixed, well-mixed and fjord-type estuaries as defined by Wollast and Duinker (1982) Numbers and shading show salinity values |
|
Sketch of main circulation pattern in a fjordSketch of main circulation pattern in a fjord |
|
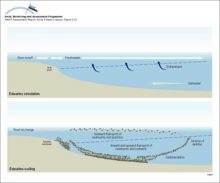
Illustration of water, sediment and nutrient cycling in estuaries Freshwater flows outward, transporting sediments, plankton and also contaminants Material that sinks into the inflowing seawater may be trapped in the estuaryIllustration of water, sediment and nutrient cycling in estuaries Freshwater flows outward, transporting sediments, plankton and also contaminants Material that sinks into the inflowing seawater may [..] |
|
Schematic representation of shelf processes involving transport of contaminants and sea iceSchematic representation of shelf processes involving transport of contaminants and sea ice |

|
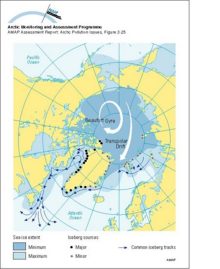
Average annual maximum and minimum sea ice extent The numbered lines show the expected time in years for the ice at that location to exit the Arctic Ocean through the Fram Strait, based on drifting buoy data during 1979-1990Average annual maximum and minimum sea ice extent The numbered lines show the expected time in years for the ice at that location to exit the Arctic Ocean through the Fram Strait, based on drifting [..] |

|
Main sources of icebergs and common iceberg drift trajectories The main ice circulation pattern follows the Transpolar Drift in the eastern Arctic and the Beaufort Gyre in the western Arctic (white arrows)Main sources of icebergs and common iceberg drift trajectories The main ice circulation pattern follows the Transpolar Drift in the eastern Arctic and the Beaufort Gyre in the western Arctic (white [..] |
|
Approximate net sea ice exchange (see legend for key to arrow sizes), extent of shorefast ice and winter sea ice, and coastal polynyas and main polynya concentrationsApproximate net sea ice exchange (see legend for key to arrow sizes), extent of shorefast ice and winter sea ice, and coastal polynyas and main polynya concentrations |
|
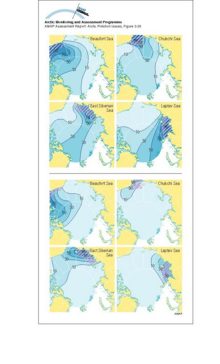
Above: contours of the asymptotic probability of ice formed in the hatched region moving into different parts of the Arctic Basin Below: contours of the asymptotic probability of ice moving from different areas into the hatched region and meltingAbove: contours of the asymptotic probability of ice formed in the hatched region moving into different parts of the Arctic Basin Below: contours of the asymptotic probability of ice moving from [..] |
|

water OR waste searches for either of these words
oceans AND biodiversity searches for blocks with both words
pollution NEAR water searches for blocks with either of these words, with them being closer ranks higher
"climate change" searches for this phrase