Your query returned 147 graphics.
Results 1 - 15
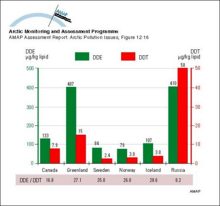
Mean maternal plasma lipid concentrations of DDE and DDT; figures below the graph show the DDE/DDT ratiosMean maternal plasma lipid concentrations of DDE and DDT; figures below the graph show the DDE/DDT ratios |
|
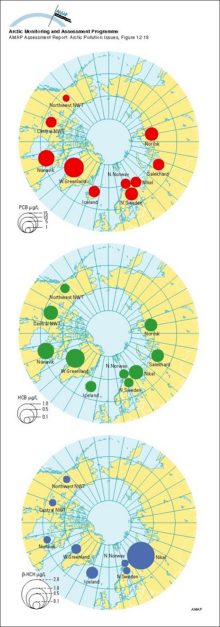
Geometric mean concentrations of PCB, HCB and B-HCH in maternal blood plasma; AMAP circumpolar study 1995, see Table 12A12Geometric mean concentrations of PCB, HCB and B-HCH in maternal blood plasma; AMAP circumpolar study 1995, see Table 12A12 |
|
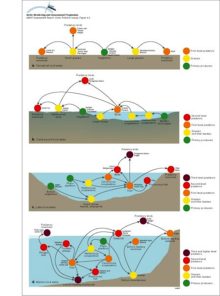
Illustration of the concept of a) the 'zone of influence' through major contaminant pathways from a major source region, and b) the 'contaminant focussing zone' resulting from the convergence of pathways carrying contaminants from a variety of sourcesIllustration of the concept of a) the 'zone of influence' through major contaminant pathways from a major source region, and b) the 'contaminant focussing zone' resulting from the convergence of [..] |

|
Examples of Arctic food webs, a) terrestrial, b) tundra pond, c) lake, and d) marineExamples of Arctic food webs, a) terrestrial, b) tundra pond, c) lake, and d) marine |
|
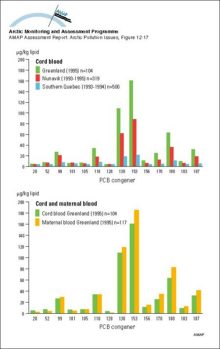
PCB congener profiles in cord blood of Canadian and Greenlandic population groups, and in cord and maternal blood from GreenlandPCB congener profiles in cord blood of Canadian and Greenlandic population groups, and in cord and maternal blood from Greenland |
|
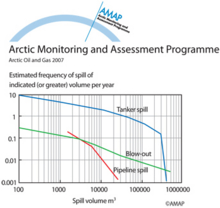
Relationship between frequency and volume of releases to the marine environment from different sources (worldwide)Relationship between frequency and volume of releases to the marine environment from different sources (worldwide) |
|
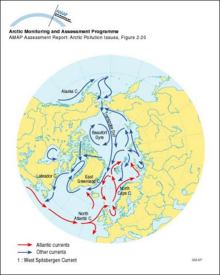
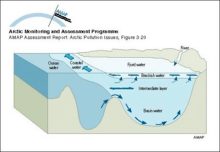
Surface ocean currents in the ArcticSurface ocean currents in the Arctic |
|
Major pathways of contaminants into and within the Arctic environmentA multi-compartment schematic diagram of the major pathways of contaminants into and within the Arctic environment |

|
Contaminant emissions, transport and deposition in the ArcticAn illustration of the interplay between a) contaminant emissions distribution for sulfur dioxide and b) frequency of atmospheric south-to-north transport, yielding c) a net annual input of sulfur to [..] |

|
Conceptual model of the terrestrial/freshwater compartment showing the main subcompartments and contaminant transfers, and exchanges with the atmosphere and oceansConceptual model of the terrestrial/freshwater compartment showing the main subcompartments and contaminant transfers, and exchanges with the atmosphere and oceans |
|
Conceptual model of the coastal zone and marine environments showing the main subcompartments and contaminant transfers, and exchanges with the atmosphereConceptual model of the coastal zone and marine environments showing the main subcompartments and contaminant transfers, and exchanges with the atmosphere |

|
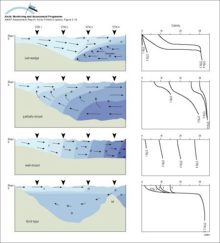
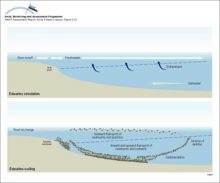
Basic circulation and salinity distribution in salt wedge, partially-mixed, well-mixed and fjord-type estuaries as defined by Wollast and Duinker (1982) Numbers and shading show salinity valuesBasic circulation and salinity distribution in salt wedge, partially-mixed, well-mixed and fjord-type estuaries as defined by Wollast and Duinker (1982) Numbers and shading show salinity values |
|
Sketch of main circulation pattern in a fjordSketch of main circulation pattern in a fjord |
|
Illustration of water, sediment and nutrient cycling in estuaries Freshwater flows outward, transporting sediments, plankton and also contaminants Material that sinks into the inflowing seawater may be trapped in the estuaryIllustration of water, sediment and nutrient cycling in estuaries Freshwater flows outward, transporting sediments, plankton and also contaminants Material that sinks into the inflowing seawater may [..] |
|
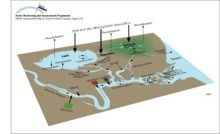
Schematic representation of shelf processes involving transport of contaminants and sea iceSchematic representation of shelf processes involving transport of contaminants and sea ice |

|

water OR waste searches for either of these words
oceans AND biodiversity searches for blocks with both words
pollution NEAR water searches for blocks with either of these words, with them being closer ranks higher
"climate change" searches for this phrase