|
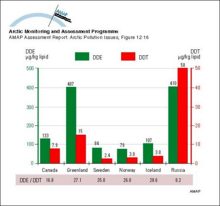
Mean maternal plasma lipid concentrations of DDE and DDT; figures below the graph show the DDE/DDT ratios
|
|
|
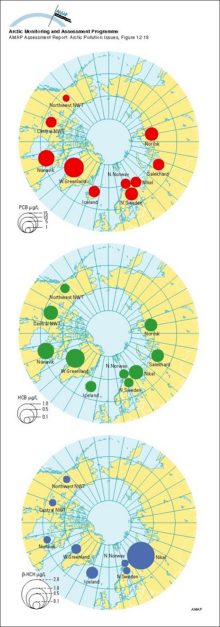
Geometric mean concentrations of PCB, HCB and B-HCH in maternal blood plasma; AMAP circumpolar study 1995, see Table 12A12
|
|
|
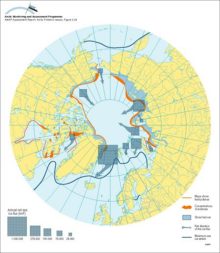
Approximate net sea ice exchange (see legend for key to arrow sizes), extent of shorefast ice and winter sea ice, and coastal polynyas and main polynya concentrations
|
|
|
An example of a positive feedback loop Warming leads to a decrease in sea ice cover which in turn leads to a decrease in albedo over the ocean, the result of which is further warming and further [..]
|

|
|
Schematic representation of shelf processes involving transport of contaminants and sea ice
|

|
|
Average annual maximum and minimum sea ice extent The numbered lines show the expected time in years for the ice at that location to exit the Arctic Ocean through the Fram Strait, based on drifting [..]
|

|
|
Historical profiles of PCBs (trichloro- and all other) in slices from dated sediment cores in Alaska, Canada, and Finland Median age of each slice is given on the vertical axis The green lines [..]
|

|
|
alpha-HCH (ng/L) in seawater: an illustration of the cold condensation effect
|
|
|
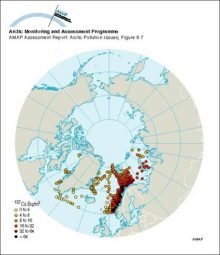
Cs-137 activity concentrations in surface seawater in 1979 and 1982
|
|
|
Seawater concentrations of 137Cs in the Barents and East Greenland Seas compared to the yearly releases from Sellafield
|

|
|
Distribution of organochlorine contaminants (OCs) in Arctic air, snow, seawater, and the marine mammals food chain Data for the six major classes of OCs are plotted for each compartment or species as [..]
|

|
|
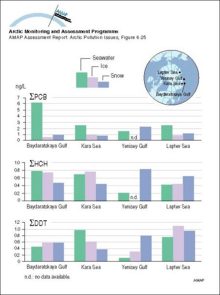
Concentrations of sum-PCB, sum-HCH, and sum-DDT in seawater, ice, and overlying snow collected at approximately the same locations in the Russian Arctic in 1993-95
|
|
|
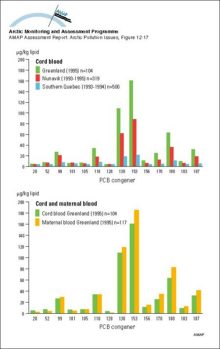
PCB congener profiles in cord blood of Canadian and Greenlandic population groups, and in cord and maternal blood from Greenland
|
|
|
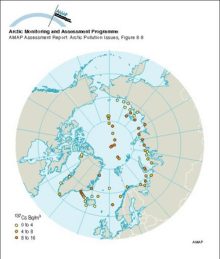
Cs-137 activity concentrations in surface seawater in 1994
|
|
|
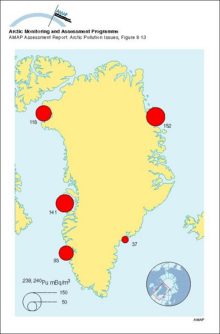
Concentrations of 239,240Pu in seawater around Greenland, 1968
|
|

water OR waste searches for either of these words
oceans AND biodiversity searches for blocks with both words
pollution NEAR water searches for blocks with either of these words, with them being closer ranks higher
"climate change" searches for this phrase