Your query returned 85 graphics.
Results 61 - 75
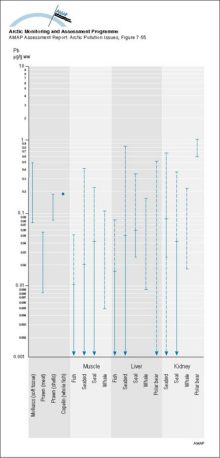
Summary of ranges of Pb levels (mean values) in Arctic marine organisms Solid parts of the lines indicate ranges for Greenlandic dataSummary of ranges of Pb levels (mean values) in Arctic marine organisms Solid parts of the lines indicate ranges for Greenlandic data |
|
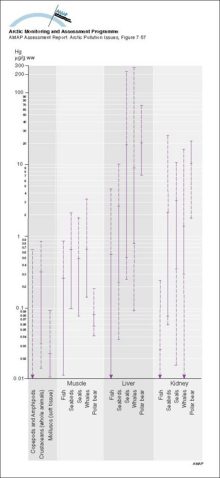
Summary of ranges of Hg levels (mean values) in Arctic marine organisms Solid parts of the lines indicate ranges for Greenlandic dataSummary of ranges of Hg levels (mean values) in Arctic marine organisms Solid parts of the lines indicate ranges for Greenlandic data |
|
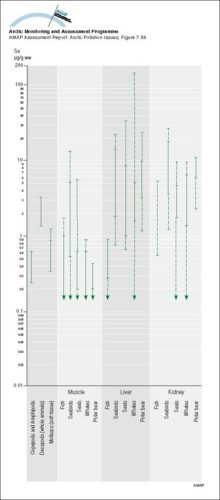
Summary of ranges of Se levels (mean values) in Arctic marine organisms Solid parts of the lines indicate ranges for Greenlandic dataSummary of ranges of Se levels (mean values) in Arctic marine organisms Solid parts of the lines indicate ranges for Greenlandic data |
|
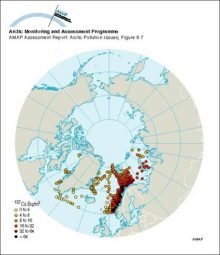
Cs-137 activity concentrations in surface seawater in 1979 and 1982Cs-137 activity concentrations in surface seawater in 1979 and 1982 |
|
Seawater concentrations of 137Cs in the Barents and East Greenland Seas compared to the yearly releases from SellafieldSeawater concentrations of 137Cs in the Barents and East Greenland Seas compared to the yearly releases from Sellafield |

|
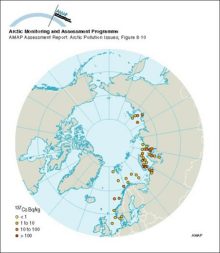
Average 137Cs activity concentrations in surface sediments of some Arctic seas sampled from 1992 to 1995Average 137Cs activity concentrations in surface sediments of some Arctic seas sampled from 1992 to 1995 |
|
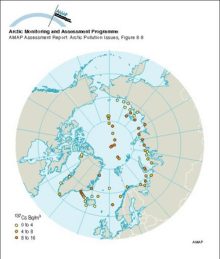
Cs-137 activity concentrations in surface seawater in 1994Cs-137 activity concentrations in surface seawater in 1994 |
|
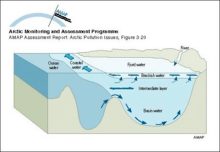
Conceptual model of the coastal zone and marine environments showing the main subcompartments and contaminant transfers, and exchanges with the atmosphereConceptual model of the coastal zone and marine environments showing the main subcompartments and contaminant transfers, and exchanges with the atmosphere |

|
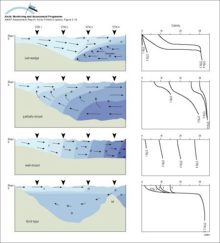
Basic circulation and salinity distribution in salt wedge, partially-mixed, well-mixed and fjord-type estuaries as defined by Wollast and Duinker (1982) Numbers and shading show salinity valuesBasic circulation and salinity distribution in salt wedge, partially-mixed, well-mixed and fjord-type estuaries as defined by Wollast and Duinker (1982) Numbers and shading show salinity values |
|
Advanced Very High Resolution Radiometer (AVHRR) satellite image (June 4, 1986) showing a color composite of the visible data band for the Mackenzie Delta River water overflowing the landfast ice can be seen as purple regionsAdvanced Very High Resolution Radiometer (AVHRR) satellite image (June 4, 1986) showing a color composite of the visible data band for the Mackenzie Delta River water overflowing the landfast ice can [..] |
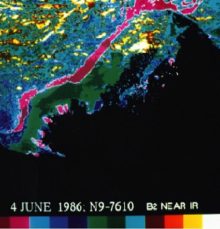
|
Sketch of main circulation pattern in a fjordSketch of main circulation pattern in a fjord |
|
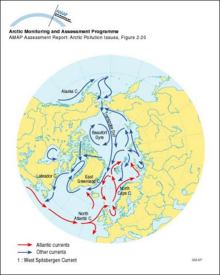
Surface ocean currents in the ArcticSurface ocean currents in the Arctic |
|
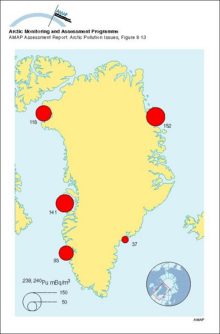
Concentrations of 239,240Pu in seawater around Greenland, 1968Concentrations of 239,240Pu in seawater around Greenland, 1968 |
|
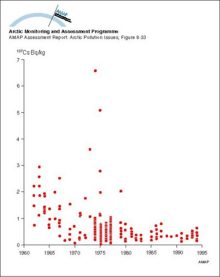
Changes with time in 137Cs activity concentration in marine fish from Greenland watersChanges with time in 137Cs activity concentration in marine fish from Greenland waters |
|
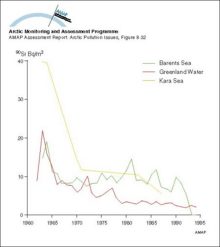
Changes with time in 90Sr activity concentrations in surface seawater from Greenland waters and the Barents and Kara SeasChanges with time in 90Sr activity concentrations in surface seawater from Greenland waters and the Barents and Kara Seas |
|

water OR waste searches for either of these words
oceans AND biodiversity searches for blocks with both words
pollution NEAR water searches for blocks with either of these words, with them being closer ranks higher
"climate change" searches for this phrase