|
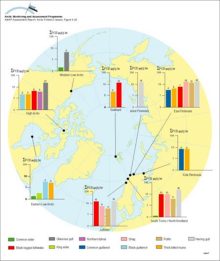
Levels of PCBs in seabird eggs (µg/g lw) Values written above bars are actual mean concentrations Wet weight means are given in Annex Table 6A16
|
|
|
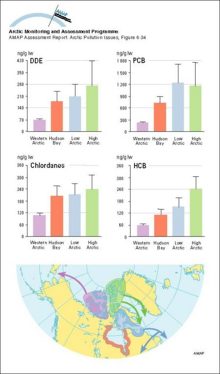
Migration patterns of four main stocks of eider ducks from the Canadian Arctic Organochlorines in the same four stocks
|
|
|
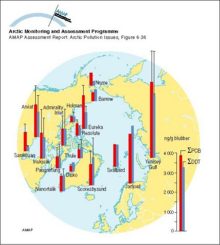
Sum-PCB and sum-DDT in ringed seal blubber (µg/g) Vertical bars denote standard deviation
|
|
|
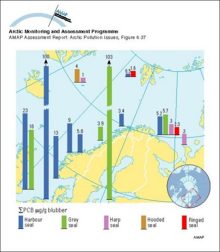
Sum-PCB levels in pinnipeds in Norway
|
|
|
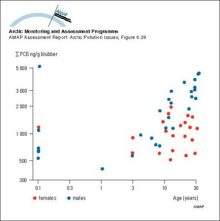
Variation of PCB with age in blubber of ringed seals (western Hudson Bay, Canada) A total of 24 females and 30 males were analyzed
|
|
|
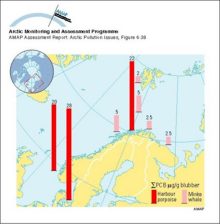
Sum-PCB levels in cetaceans in Norway
|
|
|
Correlations between concentrations (lw) of major persistent OCs and trophic level in the marine food web for Svalbard and Lancaster Sound Trophic level data were assigned based on Hobson and Welch [..]
|

|
|
Schematic representation of shelf processes involving transport of contaminants and sea ice
|

|
|
Average annual maximum and minimum sea ice extent The numbered lines show the expected time in years for the ice at that location to exit the Arctic Ocean through the Fram Strait, based on drifting [..]
|

|
|
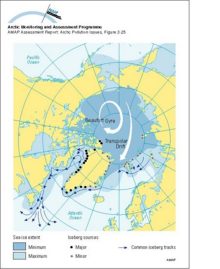
Main sources of icebergs and common iceberg drift trajectories The main ice circulation pattern follows the Transpolar Drift in the eastern Arctic and the Beaufort Gyre in the western Arctic (white [..]
|
|
|
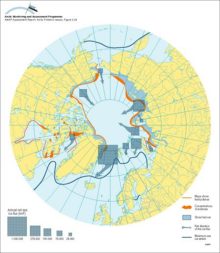
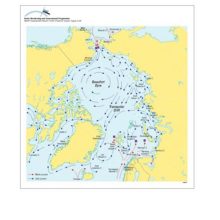
Approximate net sea ice exchange (see legend for key to arrow sizes), extent of shorefast ice and winter sea ice, and coastal polynyas and main polynya concentrations
|
|
|
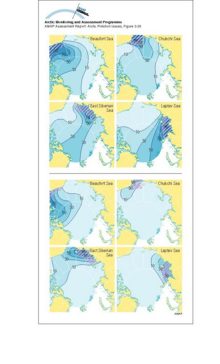
Above: contours of the asymptotic probability of ice formed in the hatched region moving into different parts of the Arctic Basin Below: contours of the asymptotic probability of ice moving from [..]
|
|
|
The predominant currents in the Arctic Ocean and their major routes around the basin edges of the Arctic
|
|
|
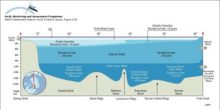
A schematic representation of the three-layer structure of the Arctic Ocean, with the Arctic Surface Layer above the Atlantic Water and Arctic Deep Water The residence time for the different water [..]
|
|
|
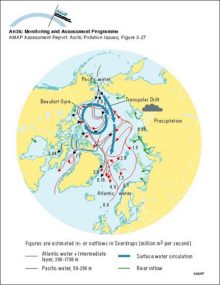
Surface currents in the Arctic region Square boxes indicate that the denser inflowing (Atlantic and Pacific) waters are submerging under the Polar Surface Water The continuation of these flows can be [..]
|
|

water OR waste searches for either of these words
oceans AND biodiversity searches for blocks with both words
pollution NEAR water searches for blocks with either of these words, with them being closer ranks higher
"climate change" searches for this phrase