|
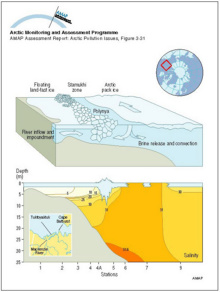
A schematic diagram showing the inflow from the Mackenzie River trapped in the nearshore zone beneath the landfast ice Beyond the stamukhi zone, intermittent opening and refreezing in the flaw lead [..]
|
|
|
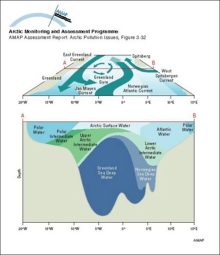
Distribution of potential temperature, salinity, and density across the Arctic Ocean and the Greenland and Norwegian Seas
|

|
|
Schematic diagrams of the Greenland Sea showing the surface circulation (above) and water mass structure at a section across the central gyre (below)
|
|
|
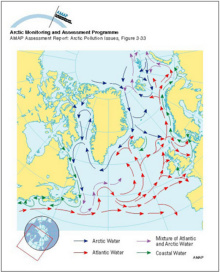
Major surface currents in the North Atlantic Ocean
|
|
|
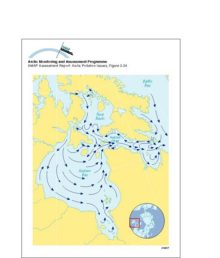
Surface currents in Hudson Bay, Hudson Strait and Foxe Basin
|
|
|
Transport of 90Sr, originating from Sellafield, along the coast of Norway The highest values are found in the Norwegian Coastal Current and decrease northward
|

|
|
Temperature and salinity of the Labrador Sea The cold freshwater from the Arctic Ocean and Baffin Bay is seen above the continental shelf
|

|
|
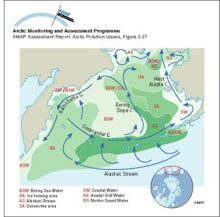
Schematic diagram of circulation and the extent of different water masses in the Bering Sea
|
|
|
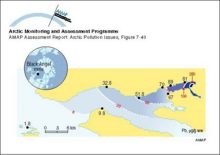
Lead levels in blue mussels (Mytilus edulis) in the fjord outside the Black Angel lead-zinc mine in West Greenland in 1986-87 Values on the fjord coast are measured concentrations Estimated [..]
|
|
|
Local differences in Cd concentrations in sedentary and stationary algae and biota from Nuuk and Uummannaq fjords, central West Greenland Levels are plotted as the percentage of the maximum [..]
|
|
|
Temporal trend of Pb concentrations in growing tips of seaweed (Fucus vesiculosus) at the Black Angel lead-zinc mine in West Greenland The background value is estimated to be 02 µg/g dw
|

|
|
Temporal trend of Pb concentrations in liver tissue of spotted wolffish (Anarhichas minor) at the Black Angel lead-zinc mine in West Greenland
|

|
|
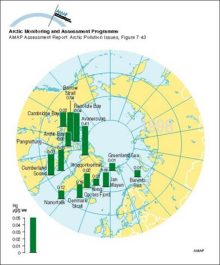
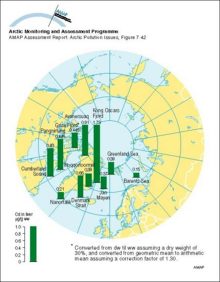
Circumpolar distribution of Hg levels in muscle tissue of Arctic cod (Boreogadus saida) Arithmetic mean concentrations
|
|
|
Circumpolar distribution of Cd levels in liver tissue of Arctic cod (Boreogadus saida) Arithmetic mean concentrations
|
|
|
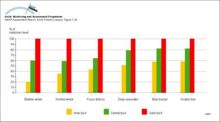
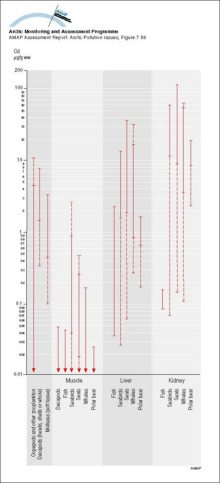
Summary of ranges of Cd levels (mean values) in Arctic marine organisms Solid parts of the lines indicate ranges for Greenlandic data
|
|

water OR waste searches for either of these words
oceans AND biodiversity searches for blocks with both words
pollution NEAR water searches for blocks with either of these words, with them being closer ranks higher
"climate change" searches for this phrase