|
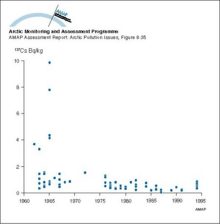
Changes with time in 137Cs activity concentration in marine fish from Greenland waters
|
|
|
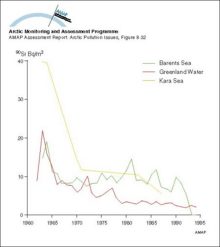
Changes with time in 90Sr activity concentrations in surface seawater from Greenland waters and the Barents and Kara Seas
|
|
|
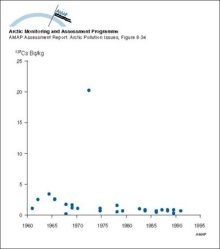
Changes with time in 137Cs activity concentration in whales from Greenland waters
|
|
|
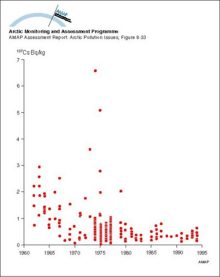
Changes with time in 137Cs activity concentration in seals from Greenland waters
|
|
|
Locations of sea dumping of radioactive waste in the Russian Arctic
|

|
|
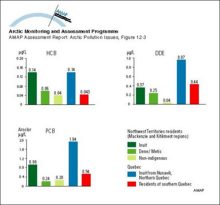
Geometric mean levels of HCB, DDE and PCBs in cord blood of newborns in different Canadian population groups
|
|
|
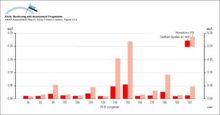
Concentrations of PCB congeners in cord plasma from Nunavik and southern Quebec newborns
|
|
|
Schematic representation of shelf processes involving transport of contaminants and sea ice
|

|
|
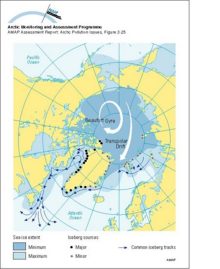
Average annual maximum and minimum sea ice extent The numbered lines show the expected time in years for the ice at that location to exit the Arctic Ocean through the Fram Strait, based on drifting [..]
|

|
|
Main sources of icebergs and common iceberg drift trajectories The main ice circulation pattern follows the Transpolar Drift in the eastern Arctic and the Beaufort Gyre in the western Arctic (white [..]
|
|
|
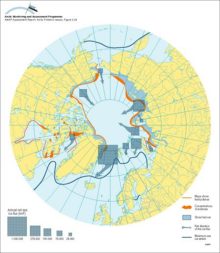
Approximate net sea ice exchange (see legend for key to arrow sizes), extent of shorefast ice and winter sea ice, and coastal polynyas and main polynya concentrations
|
|
|
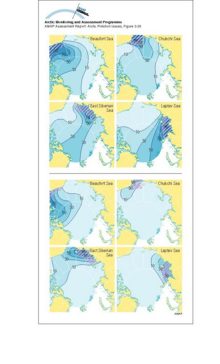
Above: contours of the asymptotic probability of ice formed in the hatched region moving into different parts of the Arctic Basin Below: contours of the asymptotic probability of ice moving from [..]
|
|
|
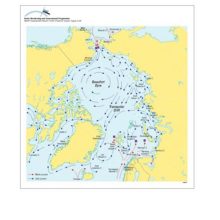
The predominant currents in the Arctic Ocean and their major routes around the basin edges of the Arctic
|
|
|
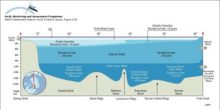
A schematic representation of the three-layer structure of the Arctic Ocean, with the Arctic Surface Layer above the Atlantic Water and Arctic Deep Water The residence time for the different water [..]
|
|
|
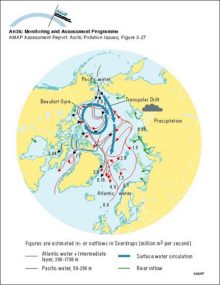
Surface currents in the Arctic region Square boxes indicate that the denser inflowing (Atlantic and Pacific) waters are submerging under the Polar Surface Water The continuation of these flows can be [..]
|
|

water OR waste searches for either of these words
oceans AND biodiversity searches for blocks with both words
pollution NEAR water searches for blocks with either of these words, with them being closer ranks higher
"climate change" searches for this phrase