Your query returned 115 graphics.
Results 46 - 60
(a) The contribution from the different sources to the total deposition, averaged over the area north of 75°N from October 1990 to May 1994, (b) the calculated total monthly depositions of SOx averaged over the area north of 75°N, and (c) the(a) The contribution from the different sources to the total deposition, averaged over the area north of 75°N from October 1990 to May 1994, (b) the calculated total monthly depositions of SOx [..] |

|
Model calculations of total (wet and dry) deposition estimates of sulfur for 1988Model calculations of total (wet and dry) deposition estimates of sulfur for 1988 |

|
Vertical distribution of Arctic haze in summer, winter, and the whole year Sulfur air concentrations and relative source-contribution (%) for different heights above the ground are shown The concentrations are averages over the Arctic area north of 70°NVertical distribution of Arctic haze in summer, winter, and the whole year Sulfur air concentrations and relative source-contribution (%) for different heights above the ground are shown The [..] |

|
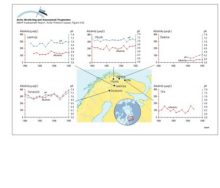
Annual average of alkalinity and pH as measured in rivers in northern Fennoscandia and the Kola PeninsulaAnnual average of alkalinity and pH as measured in rivers in northern Fennoscandia and the Kola Peninsula |
|
Annual average of sulfate and base cation concentrations as measured in rivers in northern Fennoscandia and the Kola Peninsula Note: SO4 (non-seasalt) estimated for river Utsjoki from total sulfurAnnual average of sulfate and base cation concentrations as measured in rivers in northern Fennoscandia and the Kola Peninsula Note: SO4 (non-seasalt) estimated for river Utsjoki from total sulfur |
|
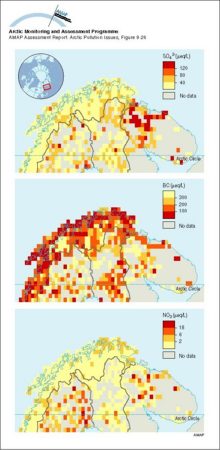
Median concentrations of sulfate, base cations, and nitrate in lakes of northern Fennoscandia and the Kola PeninsulaMedian concentrations of sulfate, base cations, and nitrate in lakes of northern Fennoscandia and the Kola Peninsula |
|
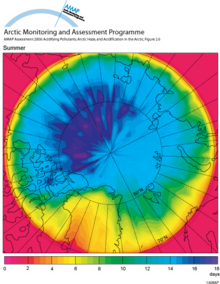
Mean arctic age of air in the lowest 100 m of the atmosphere (summer)Mean arctic age of air in the lowest 100 m of the atmosphere in July (summer) |
|
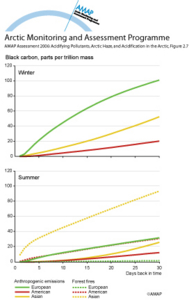
Black carbon potential source contributionsBlack carbon potential source contributions from continents as a function of transport time to the Arctic, for the subset that also reaches a minimum arctic altitude below 1000 m, for winter and [..] |
|
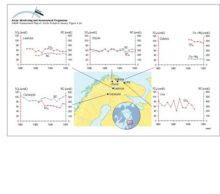
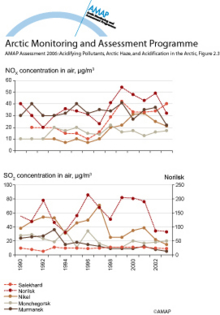
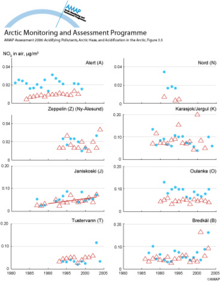
Trends in NOx and SO2 concentrationsTrends in NOx and SO2 concentrations in air in various cities in the Russian Arctic |
|
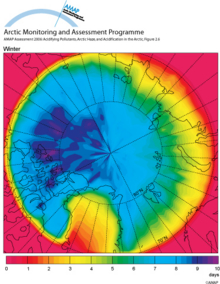
Mean arctic age of air in the lowest 100 m of the atmosphere (winter)Mean arctic age of air in the lowest 100 m of the atmosphere in January (winter) |
|
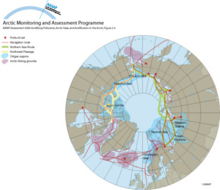
Shipping routes, oil and gas regions, and fishing grounds in the ArcticShipping routes, oil and gas regions, and fishing grounds in the Arctic |
|
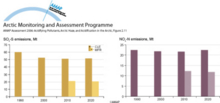
Projected total emissions of SOx-S and NOx-N between 1990 and 2020Projected total emissions of SOx-S and NOx-N between 1990 and 2020 |
|
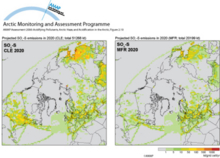
Projected SOx-S emissions in 2020 for the CLE and MFR emissions scenariosProjected SOx-S emissions in 2020 for the CLE and MFR emissions scenarios |
|
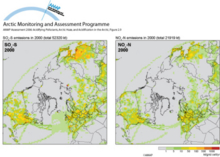
Estimated emissions of SOx-S and NOx-N in 2000Estimated emissions of SOx-S and NOx-N in 2000 |
|
Trends in summer and winter nitrate concentrations in air within the ArcticTrends in summer and winter nitrate concentrations in air within the Arctic |
|

water OR waste searches for either of these words
oceans AND biodiversity searches for blocks with both words
pollution NEAR water searches for blocks with either of these words, with them being closer ranks higher
"climate change" searches for this phrase