Your query returned 192 graphics.
Results 106 - 120
Temporal trends in PCB and DDT levels (µg/g lw ± 95% confidence limits) of otter muscle in Sweden Levels are based on means of 26, 16, and 28 samples (northern Sweden) and 29, 9, and 15 samples (southern Sweden)Temporal trends in PCB and DDT levels (µg/g lw ± 95% confidence limits) of otter muscle in Sweden Levels are based on means of 26, 16, and 28 samples (northern Sweden) and 29, 9, and 15 samples [..] |

|
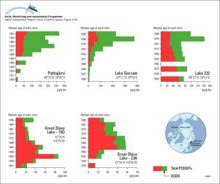
Historical profiles of PCBs (trichloro- and all other) in slices from dated sediment cores in Alaska, Canada, and Finland Median age of each slice is given on the vertical axis The green lines indicate the source function of PCBsHistorical profiles of PCBs (trichloro- and all other) in slices from dated sediment cores in Alaska, Canada, and Finland Median age of each slice is given on the vertical axis The green lines [..] |

|
The time series of light scattering (?sp) and optical depth (?) at 500 nm at Barrow, AlaskaThe time series of light scattering (?sp) and optical depth (?) at 500 nm at Barrow, Alaska |

|
Temporal trends in OC levels (ng/g lw) in reindeer from Abisko, Sweden Levels are usually based on a pool of 10 samplesTemporal trends in OC levels (ng/g lw) in reindeer from Abisko, Sweden Levels are usually based on a pool of 10 samples |

|
Concentrations, as geometric means, of major organochlorine groups in burbot liver at Fort Good Hope, NWT, Canada (1986-94) Vertical bars denote standard errorsConcentrations, as geometric means, of major organochlorine groups in burbot liver at Fort Good Hope, NWT, Canada (1986-94) Vertical bars denote standard errors |

|
Temporal trends in levels of PCB, DDT, alpha-HCH, and HCB in muscle from Lake Storvindeln pike and Lake Abiskojaure char in Sweden Mean levels (µg/g lw) and 95% confidence intervals of the mean are represented by dark points,Temporal trends in levels of PCB, DDT, alpha-HCH, and HCB in muscle from Lake Storvindeln pike and Lake Abiskojaure char in Sweden Mean levels (µg/g lw) and 95% confidence intervals of the mean are [..] |

|
Temporal trends in PCB and DDE levels in Arctic seabird eggs from Prince Leopold Island, Canada (1975-1993)Temporal trends in PCB and DDE levels in Arctic seabird eggs from Prince Leopold Island, Canada (1975-1993) |

|
Levels of PCB congeners and PCDD/Fs (ng/g lw) in Lake Storvindeln pike muscle between 1968 and 1992Levels of PCB congeners and PCDD/Fs (ng/g lw) in Lake Storvindeln pike muscle between 1968 and 1992 |

|
Temporal trends of sum-PCB and sum-DDT in blubber of female ringed seals from Holman Island in the western Canadian Arctic Vertical bars represent one SDTemporal trends of sum-PCB and sum-DDT in blubber of female ringed seals from Holman Island in the western Canadian Arctic Vertical bars represent one SD |

|
Trends in sum-PCB, sum-DDT, sum-CHL, and toxaphene over a ten year period (20 years for DDT in the Mackenzie Delta) for male narwhal and beluga blubber samples from the Canadian Arctic (N=8-26)Trends in sum-PCB, sum-DDT, sum-CHL, and toxaphene over a ten year period (20 years for DDT in the Mackenzie Delta) for male narwhal and beluga blubber samples from the Canadian Arctic (N=8-26) |

|
Trends in concentration of major organochlorines in blubber of female ringed seals over 6 to 10 years at 3 sites in the eastern Canadian Arctic (N=10-14 animals for each year/site)Trends in concentration of major organochlorines in blubber of female ringed seals over 6 to 10 years at 3 sites in the eastern Canadian Arctic (N=10-14 animals for each year/site) |

|
Concentration (pg/g dw) profiles for octachlorodioxin (OCDD) and total PCDD/Fs in dated sediment cores from Arctic Canada and Finland Sum-PCDD/Fs = sum of 2,3,7,8-substituted tetra- to octachloro D/Fs plus non-2,3,7,8-substituted congenersConcentration (pg/g dw) profiles for octachlorodioxin (OCDD) and total PCDD/Fs in dated sediment cores from Arctic Canada and Finland Sum-PCDD/Fs = sum of 2,3,7,8-substituted tetra- to octachloro D/Fs [..] |
|
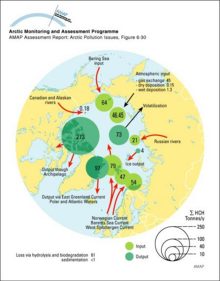
Sum-HCH budget for the Arctic Ocean (tonnes/y)Sum-HCH budget for the Arctic Ocean (tonnes/y) |
|
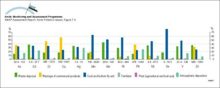
Global anthropogenic inputs of trace metals to soils at the beginning of the 1980s Numbers under the columns are the range of estimates of the inputs in thousands of tonnes per yearGlobal anthropogenic inputs of trace metals to soils at the beginning of the 1980s Numbers under the columns are the range of estimates of the inputs in thousands of tonnes per year |
|
Contaminant emissions, transport and deposition in the ArcticAn illustration of the interplay between a) contaminant emissions distribution for sulfur dioxide and b) frequency of atmospheric south-to-north transport, yielding c) a net annual input of sulfur to [..] |

|

water OR waste searches for either of these words
oceans AND biodiversity searches for blocks with both words
pollution NEAR water searches for blocks with either of these words, with them being closer ranks higher
"climate change" searches for this phrase