Your query returned 214 graphics.
Results 136 - 150
Snow cover over northern hemisphere lands between 1972 and 1996 for different seasons Values are determined from analyses of NOAA snow charts created using visible satellite imagerySnow cover over northern hemisphere lands between 1972 and 1996 for different seasons Values are determined from analyses of NOAA snow charts created using visible satellite imagery |

|
History of temperature changes in central Greenland over the last 40 000 years, from the GISP2 core, showing very large and probably abrupt changesHistory of temperature changes in central Greenland over the last 40 000 years, from the GISP2 core, showing very large and probably abrupt changes |

|
History of snow accumulation in central Greenland during the most recent glaciation, as measured in the GISP2 core The 25-year running mean, represented in all panels, shows very large and rapid climate changesHistory of snow accumulation in central Greenland during the most recent glaciation, as measured in the GISP2 core The 25-year running mean, represented in all panels, shows very large and rapid [..] |

|
Trends in (annual average) ozone mixing ratio over Canada from 1980 to 1993Trends in (annual average) ozone mixing ratio over Canada from 1980 to 1993 |

|
Body burdens of radiocaesium (yearly averages) across the Canadian ArcticBody burdens of radiocaesium (yearly averages) across the Canadian Arctic |

|
Concentration (pg/g dw) profiles for octachlorodioxin (OCDD) and total PCDD/Fs in dated sediment cores from Arctic Canada and Finland Sum-PCDD/Fs = sum of 2,3,7,8-substituted tetra- to octachloro D/Fs plus non-2,3,7,8-substituted congenersConcentration (pg/g dw) profiles for octachlorodioxin (OCDD) and total PCDD/Fs in dated sediment cores from Arctic Canada and Finland Sum-PCDD/Fs = sum of 2,3,7,8-substituted tetra- to octachloro D/Fs [..] |
|
Contaminant emissions, transport and deposition in the ArcticAn illustration of the interplay between a) contaminant emissions distribution for sulfur dioxide and b) frequency of atmospheric south-to-north transport, yielding c) a net annual input of sulfur to [..] |

|
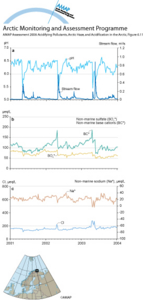
Surface water runoff from the Dalelva catchment, northeastern Norway, 2001–2003Surface water runoff from the Dalelva catchment, northeastern Norway, 2001–2003. (a) streamwater flow and pH, (b) non-marine concentrations of sulfate and base cations, and (c) chloride and non-marine [..] |
|
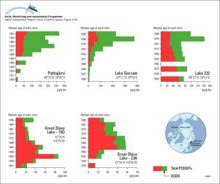
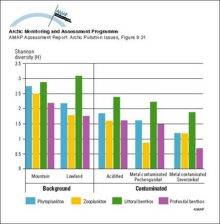
Diversity indices (Shannon-Weaver means) for phytoplankton, zooplankton and zoobenthos in lakes and streams in the Murmansk regionDiversity indices (Shannon-Weaver means) for phytoplankton, zooplankton and zoobenthos in lakes and streams in the Murmansk region |
|
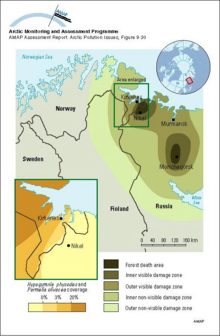
Approximate forest damage zones in the vicinity of Monchegorsk and Nikel and the visible-damage and non-visible-damage zones on the Kola Peninsula and Finnish Lapland The inset shows coverage (%) of lichens (Hypogymnia physodes and Parmelia olivacea) onApproximate forest damage zones in the vicinity of Monchegorsk and Nikel and the visible-damage and non-visible-damage zones on the Kola Peninsula and Finnish Lapland The inset shows coverage (%) of [..] |
|
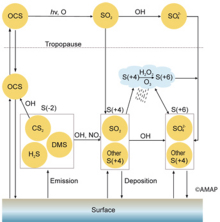
Atmospheric sulphur cycleAtmospheric sulphur cycle |
|
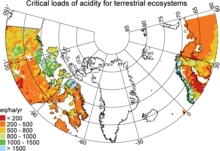
Critical loads of acidity for soilsCritical loads of acidity for terrestrial ecosystems in northern Europe and Canada north of 60 degrees N. |
|
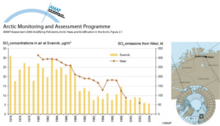
Sulphur dioxide concentrations in air and emissions from the smelter at NikelAnnual SO2 concentrations in air at ground level at the Svanvik monitoring station, and SO2 emissions from the non-ferrous metal smelters at Nikel |
|
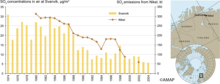
SO2 concentration at the Svanvik monitoring stationAnnual SO2 concentration in air at ground level at the Svanvik monitoring station and SO2 emissions from the non-ferrous metal smelters at Nikel |
|
Annual average of alkalinity and pH as measured in rivers in northern Fennoscandia and the Kola PeninsulaAnnual average of alkalinity and pH as measured in rivers in northern Fennoscandia and the Kola Peninsula |
|

water OR waste searches for either of these words
oceans AND biodiversity searches for blocks with both words
pollution NEAR water searches for blocks with either of these words, with them being closer ranks higher
"climate change" searches for this phrase