Your query returned 142 graphics.
Results 1 - 15
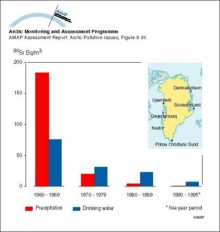
Ten-year averages of 90Sr activity concentrations in drinking water and precipitation in GreenlandTen-year averages of 90Sr activity concentrations in drinking water and precipitation in Greenland |
|
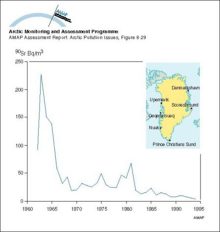
Changes with time in average activity concentration of 90Sr in drinking water in GreenlandChanges with time in average activity concentration of 90Sr in drinking water in Greenland |
|
Time trends of mean methylmercury concentrationsTime trends of mean methylmercury concentrations |

|
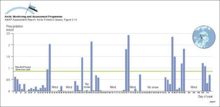
Precipitation rate measurements from Alert from January through April 1992 showing periods of no snow, periods of no snow measured due to wind events, and the relatively large quantities of precipitation on days duringPrecipitation rate measurements from Alert from January through April 1992 showing periods of no snow, periods of no snow measured due to wind events, and the relatively large quantities of [..] |
|
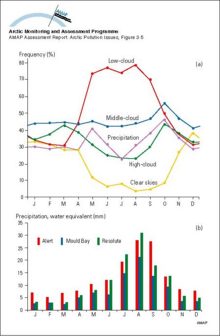
Cloud cover and precipitation in the Canadian High ArcticSeasonal variation in a) cloud cover and precipitation occurrence and b) precipitation amount in the Canadian High Arctic, 1951-1980 norms |
|
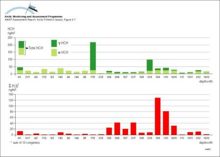
The relative contribution to the 137Cs content of the diet of the ‘average’ population of various Arctic areas for the period 1990 to 1994The relative contribution to the 137Cs content of the diet of the ‘average’ population of various Arctic areas for the period 1990 to 1994 |
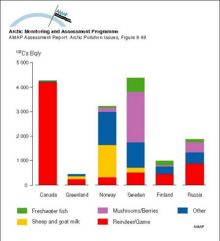
|
The relative contribution to the 137Cs content of the diet of the ‘selected’ population of various Arctic areas for the period 1990 to 1994The relative contribution to the 137Cs content of the diet of the ‘selected’ population of various Arctic areas for the period 1990 to 1994 |
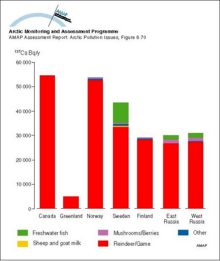
|
Variation of the nitrate to non-seasalt (nss) sulfate equivalent ratio in precipitation at Norwegian recording stations based on measurements between August 1982 and July 1984Variation of the nitrate to non-seasalt (nss) sulfate equivalent ratio in precipitation at Norwegian recording stations based on measurements between August 1982 and July 1984 |
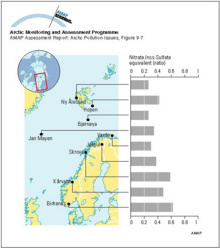
|
Locations of background monitoring stations for air and precipitation chemistryLocations of background monitoring stations for air and precipitation chemistry, and arctic haze and the Russian precipitation chemistry stations |
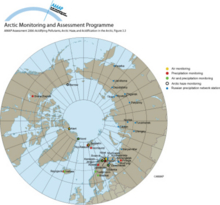
|
Flux of HCH and sum-PCB (sum of 10 congeners) in precipitation at Heimaey Island, IcelandFlux of HCH and sum-PCB (sum of 10 congeners) in precipitation at Heimaey Island, Iceland |
|
Distribution of radioactivity (PCi/L) in the surface layer of the ocean after ten years of simulation of Preller's model Source locations are the Ob, Yenisey and Pechora Rivers, as well as SellafieldDistribution of radioactivity (PCi/L) in the surface layer of the ocean after ten years of simulation of Preller's model Source locations are the Ob, Yenisey and Pechora Rivers, as well as Sellafield |

|
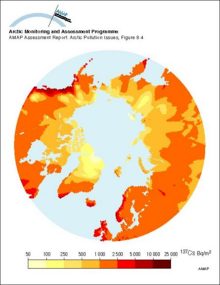
Estimated ground deposition of nuclear weapons fallout of 137Cs based on precipitation data, decay corrected to 1995Estimated ground deposition of nuclear weapons fallout of 137Cs based on precipitation data, decay corrected to 1995 |
|
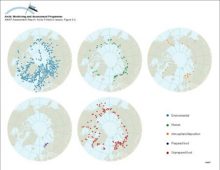
Geographical distribution of sample information in the AMAP radioactivity databaseGeographical distribution of sample information in the AMAP radioactivity database |
|
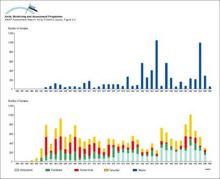
Available data in the AMAP radioactivity database as a function of timeAvailable data in the AMAP radioactivity database as a function of time |
|
Ranges and average values of 137Cs activity concentrations in food products, from data in the AMAP radioactivity databaseRanges and average values of 137Cs activity concentrations in food products, from data in the AMAP radioactivity database |

|

water OR waste searches for either of these words
oceans AND biodiversity searches for blocks with both words
pollution NEAR water searches for blocks with either of these words, with them being closer ranks higher
"climate change" searches for this phrase