Your query returned 149 graphics.
Results 1 - 15
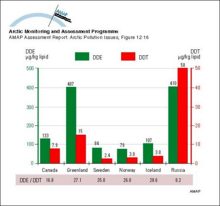
Mean maternal plasma lipid concentrations of DDE and DDT; figures below the graph show the DDE/DDT ratiosMean maternal plasma lipid concentrations of DDE and DDT; figures below the graph show the DDE/DDT ratios |
|
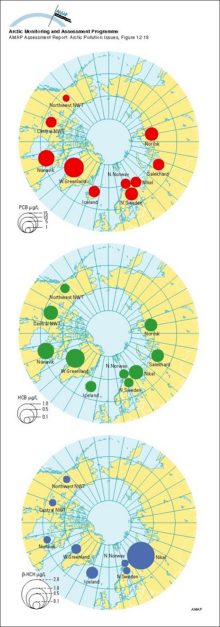
Geometric mean concentrations of PCB, HCB and B-HCH in maternal blood plasma; AMAP circumpolar study 1995, see Table 12A12Geometric mean concentrations of PCB, HCB and B-HCH in maternal blood plasma; AMAP circumpolar study 1995, see Table 12A12 |
|
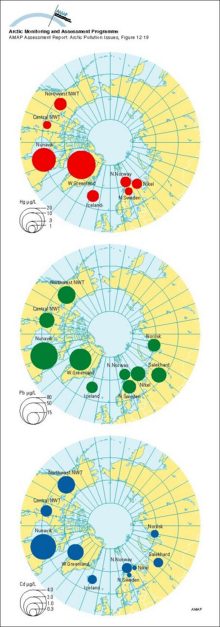
Geometric mean concentrations of mercury, lead and cadmium in maternal whole blood; AMAP circumpolar study 1994-95, see Table 12A13Geometric mean concentrations of mercury, lead and cadmium in maternal whole blood; AMAP circumpolar study 1994-95, see Table 12A13 |
|
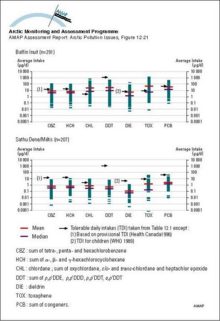
Organochlorine intake from traditional food consumed by indigenous women in the Canadian ArcticOrganochlorine intake from traditional food consumed by indigenous women in the Canadian Arctic |
|
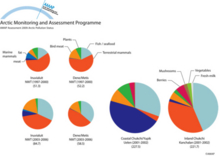
Traditional food consumption among Inuvialuit and Dene/Métis in Canada in 2003-2006 compared with that in 1997-2000Traditional food consumption among Inuvialuit and Dene/Métis in Canada in 2003-2006 compared with that in 1997-2000; and traditional food consumptions in two communities in Chukotka, Russia in [..] |
|
Time trends of mean methylmercury concentrationsTime trends of mean methylmercury concentrations |

|
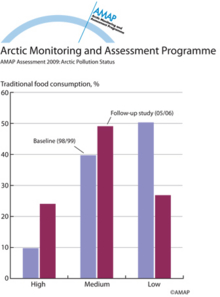
Comparison of traditional food consumption in Inuvik, Canada in 1998/1999 and 2005/2006Comparison of traditional food consumption in Inuvik, Canada in 1998/1999 and 2005/2006 |
|
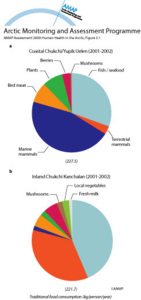
Annual consumption of traditional food in and KanchalanAnnual consumption of traditional food in (a) Uelen (coastal Chukchi and Inuit) and (b) Kanchalan (inland Chukchi), on the Chukotka Peninsula, north-east Russia |
|
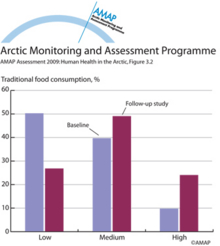
Self-reported level of traditional food consumptionSelf-reported level of traditional food consumption (low, medium, and high). Comparison between baseline (1998/1999) and MOMs study (2005/2006) |
|
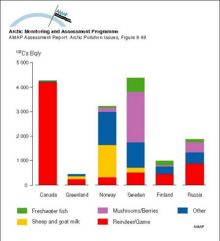
The relative contribution to the 137Cs content of the diet of the ‘average’ population of various Arctic areas for the period 1990 to 1994The relative contribution to the 137Cs content of the diet of the ‘average’ population of various Arctic areas for the period 1990 to 1994 |
|
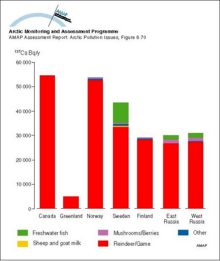
The relative contribution to the 137Cs content of the diet of the ‘selected’ population of various Arctic areas for the period 1990 to 1994The relative contribution to the 137Cs content of the diet of the ‘selected’ population of various Arctic areas for the period 1990 to 1994 |
|
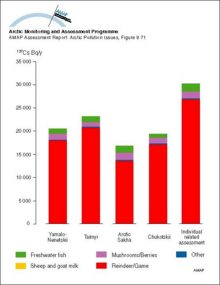
Estimated source of dietary intake of 137Cs by various indigenous population groups in different regions of Arctic Russia in 1993, and the AMAP region as a wholeEstimated source of dietary intake of 137Cs by various indigenous population groups in different regions of Arctic Russia in 1993, and the AMAP region as a whole |
|
Changes with time in 137Cs contamination in the food chain lichen - reindeer - humansChanges with time in 137Cs contamination in the food chain lichen - reindeer - humans |

|
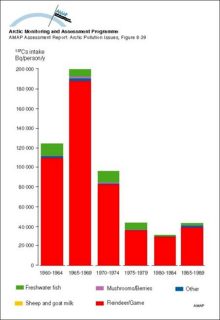
Yearly intake of 137Cs from various dietary components by the average population of Arctic FinlandYearly intake of 137Cs from various dietary components by the average population of Arctic Finland |
|
Yearly intake of 137Cs from various dietary components by the ‘selected’ population of Arctic FinlandYearly intake of 137Cs from various dietary components by the ‘selected’ population of Arctic Finland |
|

water OR waste searches for either of these words
oceans AND biodiversity searches for blocks with both words
pollution NEAR water searches for blocks with either of these words, with them being closer ranks higher
"climate change" searches for this phrase