|
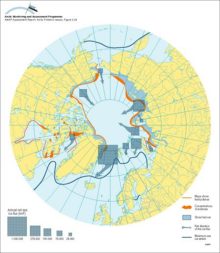
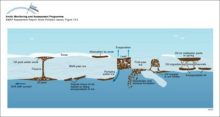
Approximate net sea ice exchange (see legend for key to arrow sizes), extent of shorefast ice and winter sea ice, and coastal polynyas and main polynya concentrations
|
|
|
Illustration of the role of UV radiation in various light-dependent processes Natural UV radiation impacts the numbers, distribution and activity of several aquatic ecosystem targets and thus, [..]
|

|
|
An example of a positive feedback loop Warming leads to a decrease in sea ice cover which in turn leads to a decrease in albedo over the ocean, the result of which is further warming and further [..]
|

|
|
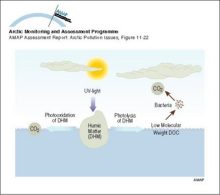
Illustration of the role of UV radiation in the biogeochemical cycling of DOC
|
|
|
Schematic representation of shelf processes involving transport of contaminants and sea ice
|

|
|
Average annual maximum and minimum sea ice extent The numbered lines show the expected time in years for the ice at that location to exit the Arctic Ocean through the Fram Strait, based on drifting [..]
|

|
|
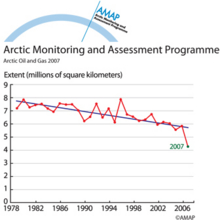
Recent observations of summer sea-ice extent
|
|
|
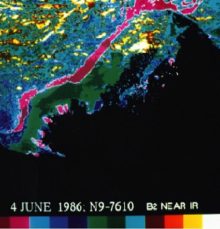
Advanced Very High Resolution Radiometer (AVHRR) satellite image (June 4, 1986) showing a color composite of the visible data band for the Mackenzie Delta River water overflowing the landfast ice can [..]
|
|
|
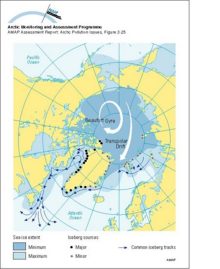
Main sources of icebergs and common iceberg drift trajectories The main ice circulation pattern follows the Transpolar Drift in the eastern Arctic and the Beaufort Gyre in the western Arctic (white [..]
|
|
|
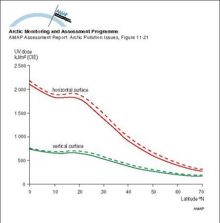
Average annual UV dose falling on vertical and horizontal surfaces as a function of latitude The solid lines represent the situation for the normal UV level with undisturbed ozone (prior to 1978)
|
|
|
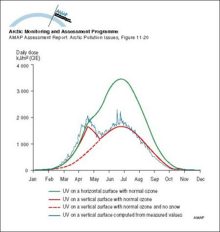
Theoretical clear day UV dose to horizontal and vertical surfaces, for Arctic Finland
|
|
|
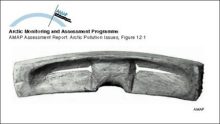
Traditional Inuit slit goggles from Greenland; the goggles protect the eyes against ultraviolet radiation
|
|
|
The hydrologic balance in the Arctic is highly dynamic on the seasonal time scale with large and rapid ice melts in the spring On land, this ice and snow melting results in large rapid floods and [..]
|

|
|
Sequence of oil-ice interaction including drops under the ice, new ice growth below the oil, oil appearing on the surface in the spring, wind herding of oil on melt pools, and the appearance of [..]
|
|
|
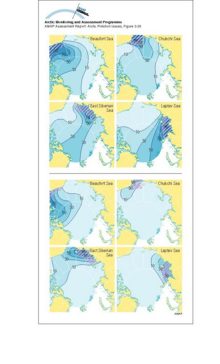
Above: contours of the asymptotic probability of ice formed in the hatched region moving into different parts of the Arctic Basin Below: contours of the asymptotic probability of ice moving from [..]
|
|

water OR waste searches for either of these words
oceans AND biodiversity searches for blocks with both words
pollution NEAR water searches for blocks with either of these words, with them being closer ranks higher
"climate change" searches for this phrase