|
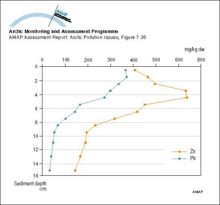
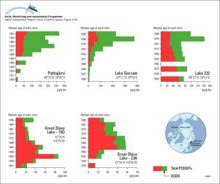
Lead and zinc in a sediment core sampled in 1991, 15 km from the Black Angel mine in West Greenland
|
|
|
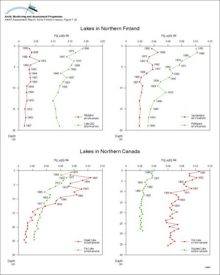
Concentrations of Hg in dated sediment cores from lakes in Arctic Finland and Canada
|
|
|
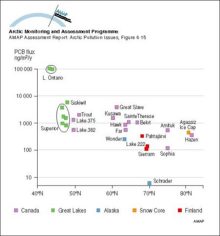
Latitudinal fluxes of sum-PCB in dated sediment cores from 25 locations including 13 Arctic locations (in Canada, Finland, and Alaska)
|
|
|
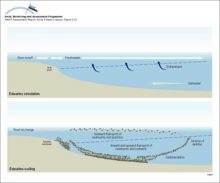
Illustration of water, sediment and nutrient cycling in estuaries Freshwater flows outward, transporting sediments, plankton and also contaminants Material that sinks into the inflowing seawater may [..]
|
|
|
Historical profiles of PCBs (trichloro- and all other) in slices from dated sediment cores in Alaska, Canada, and Finland Median age of each slice is given on the vertical axis The green lines [..]
|

|
|
Concentration (pg/g dw) profiles for octachlorodioxin (OCDD) and total PCDD/Fs in dated sediment cores from Arctic Canada and Finland Sum-PCDD/Fs = sum of 2,3,7,8-substituted tetra- to octachloro D/Fs [..]
|
|
|
Global emissions of Pb to the atmosphere from various sources and source regions in 1989 Numbers under the columns are maximum estimates of the total emissions in tonnes
|

|
|
Spatial distribution of global emissions of Hg in 1990 within a 1° x 1° grid The total emission inventory is 2144 tonnes Hg
|

|
|
Contributions from different continents and from different sources to the global emissions of Hg to the atmosphere
|

|
|
Spatial distribution of emissions of Pb within the 150 km x 150 km EMEP grid system for the area north of latitude 50° N in 1989
|

|
|
The ten major point sources, and their emissions of As and Cd to the atmosphere, in Europe at the beginning of the 1990s Numbers above the columns are emissions in tonnes per year
|

|
|
Changes with time in European atmospheric emissions of Cd, Pb and Zn
|

|
|
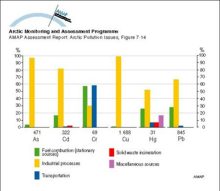
Estimates of emissions of As, Cd, Hg and Pb to the atmosphere from major source categories in the United States Numbers under the columns are emissions in tonnes per year
|

|
|
Estimates of emissions of As, Cd, Cr, Cu, Hg and Pb to the atmosphere from major source categories in Canada in 1982 Numbers under the columns are emissions in tonnes per year
|
|
|
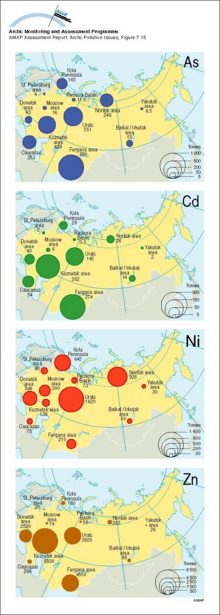
Emissions of As, Cd, Ni and Zn to the atmosphere from major sources in the former Soviet Union in 1979/80
|
|

water OR waste searches for either of these words
oceans AND biodiversity searches for blocks with both words
pollution NEAR water searches for blocks with either of these words, with them being closer ranks higher
"climate change" searches for this phrase