|
Model calculations of sulfur deposition and fraction of dry deposition for the period July 1990 to June 1991 in northern Fennoscandia and the Kola Peninsula
|

|
|
(a) The contribution from the different sources to the total deposition, averaged over the area north of 75°N from October 1990 to May 1994, (b) the calculated total monthly depositions of SOx [..]
|

|
|
Vertical distribution of Arctic haze in summer, winter, and the whole year Sulfur air concentrations and relative source-contribution (%) for different heights above the ground are shown The [..]
|

|
|
Time trends of mean methylmercury concentrations
|

|
|
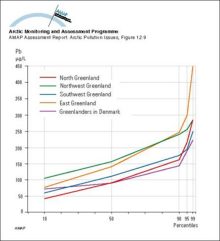
Distribution (in percentiles) of whole blood lead concentrations in four regions in Greenland and in Greenlanders living in Denmark
|
|
|
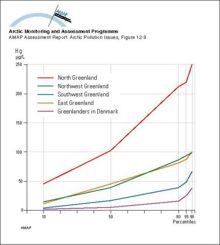
Distribution (in percentiles) of whole blood mercury concentrations in four regions in Greenland and in Greenlanders living in Denmark
|
|
|
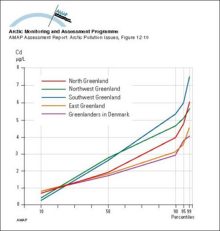
Distribution (in percentiles) of whole blood cadmium concentrations in four regions in Greenland and in Greenlanders living in Denmark
|
|
|
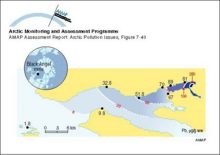
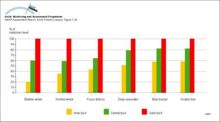
Lead levels in blue mussels (Mytilus edulis) in the fjord outside the Black Angel lead-zinc mine in West Greenland in 1986-87 Values on the fjord coast are measured concentrations Estimated [..]
|
|
|
Local differences in Cd concentrations in sedentary and stationary algae and biota from Nuuk and Uummannaq fjords, central West Greenland Levels are plotted as the percentage of the maximum [..]
|
|
|
Temporal trend of Pb concentrations in growing tips of seaweed (Fucus vesiculosus) at the Black Angel lead-zinc mine in West Greenland The background value is estimated to be 02 µg/g dw
|

|
|
Temporal trend of Pb concentrations in liver tissue of spotted wolffish (Anarhichas minor) at the Black Angel lead-zinc mine in West Greenland
|

|
|
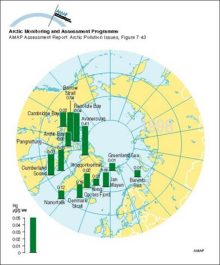
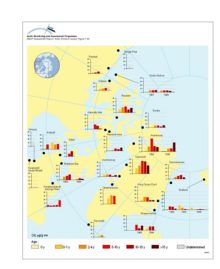
Circumpolar distribution of Hg levels in muscle tissue of Arctic cod (Boreogadus saida) Arithmetic mean concentrations
|
|
|
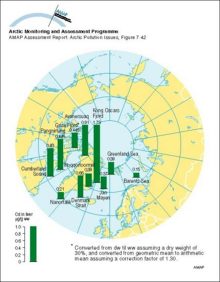
Circumpolar distribution of Cd levels in liver tissue of Arctic cod (Boreogadus saida) Arithmetic mean concentrations
|
|
|
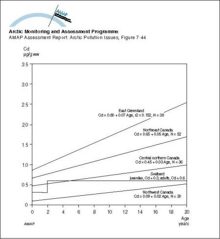
Age accumulation of Cd in liver of polar bears from different Arctic regions
|
|
|
Distribution of Cd levels in liver tissue of ringed seal (Phoca hispida) of different ages Plots show selected data (geometric mean values) from Annex Table 7A15
|
|

water OR waste searches for either of these words
oceans AND biodiversity searches for blocks with both words
pollution NEAR water searches for blocks with either of these words, with them being closer ranks higher
"climate change" searches for this phrase